AlphaFold confidence across a protein family
AlphaFold scores every residue it models with pLDDT, a number from 0 to 100 that it writes into the B-factor column of the model file, and AlphaFold DB bands those scores: above 90 very high, 70 to 90 confident, 50 to 70 low, below 50 very low. TDP-43, the protein the TARDBP gene encodes, has three folded domains and a 150-residue C-terminal region, so its models carry scores from both ends of that range. This page takes fourteen vertebrate orthologs from UniProt, aligns them, reads the pLDDT of each ortholog from its own AlphaFold model, and puts the mean per alignment column on a bar track. The folded domains are the control: the same track has to sit high there in every row, and the last section reads two columns of the models residue by residue.
Prerequisites#
curl- ClustalW,
apt install clustalwon Debian or Ubuntu,brew install clustal-won macOS. ClustalW both aligns and infers a tree, so this page needs no other aligner. - python3, standard library only
Every figure below links to the live view it captured.
Where the data comes from#
Fourteen UniProtKB entries and their AlphaFold models. AlphaFold DB is keyed on UniProt accession, so one accession fetches the sequence and the model both.
- all fourteen sequences, one request: https://rest.uniprot.org/uniprotkb/accessions?accessions=Q13148,Q921F2&format=fasta
- the AlphaFold record for an accession, which names its files: https://alphafold.ebi.ac.uk/api/prediction/Q13148
- the model whose B-factor column holds the pLDDT: https://alphafold.ebi.ac.uk/files/AF-Q13148-F1-model_v6.pdb
- the Pfam matches of the human sequence: https://www.ebi.ac.uk/interpro/api/entry/pfam/protein/uniprot/Q13148
- the row table the commands below start from, hosted so the figures can link to it: https://gmod.org/JBrowseMSA/demo/data/tdp43/tardbp-rows.tsv
- the alignment they write: https://gmod.org/JBrowseMSA/demo/data/tdp43/tardbp.afa
- its tree: https://gmod.org/JBrowseMSA/demo/data/tdp43/tardbp.nwk
- the runs each model scores under 50: https://gmod.org/JBrowseMSA/demo/data/tdp43/tardbp-lowconf.gff
- the band each row falls in per domain: https://gmod.org/JBrowseMSA/demo/data/tdp43/tardbp-rowdata.json
- the tracks and the highlights, the layers the links below carry: https://gmod.org/JBrowseMSA/demo/data/tdp43/tardbp-layers.json
1. Name the rows#
Write one species per line: the label the viewer draws, then the UniProtKB
accession. The label becomes the FASTA defline, the tree tip, the GFF seq_id and
the row of every layer.
Human	Q13148
Mouse	Q921F2
Cow	G3MX91
Elephant	G3TD75
Opossum	A0A5F8GU32
Platypus	F7EDX1
Chicken	Q5ZLN5
Turtle	K7FJ67
Lizard	A0A670IXJ6
Frog	Q28F51
Coelacanth	H3BC22
Zebrafish	Q802C7
Seabream	A0A671WI33
Ghostshark	A0A4W3GN84
Six mammals, three sauropsids, a frog, a coelacanth, two teleosts and a
chimaera. Both teleost entries are the tardbpb paralog, which runs the full
length of the protein.
2. Fetch the sequences#
One request takes every accession, and a short script rewrites each defline to the species label:
accessions=$(awk -F'\t' '{printf "%s%s", sep, $2; sep=","}' rows.tsv)
curl -sf "https://rest.uniprot.org/uniprotkb/accessions?accessions=$accessions&format=fasta" \
  -o tardbp-uniprot.fasta
Human Q13148 414 aa
Mouse Q921F2 414 aa
Cow G3MX91 414 aa
Elephant G3TD75 414 aa
Opossum A0A5F8GU32 414 aa
Platypus F7EDX1 414 aa
Chicken Q5ZLN5 414 aa
Turtle K7FJ67 414 aa
Lizard A0A670IXJ6 415 aa
Frog Q28F51 409 aa
Coelacanth H3BC22 412 aa
Zebrafish Q802C7 412 aa
Seabream A0A671WI33 406 aa
Ghostshark A0A4W3GN84 404 aaEvery ortholog is 404 to 415 residues, and eight of the nine amniotes are 414 apiece.
3. Align and infer a tree#
clustalw -INFILE=tardbp.fasta -ALIGN -TYPE=PROTEIN -OUTORDER=INPUT \
  -OUTPUT=FASTA -OUTFILE=tardbp.afa
clustalw -INFILE=tardbp.afa -TREE -TYPE=PROTEIN -OUTPUTTREE=phylip
tr -d '[:space:]' < tardbp.ph > tardbp.nwk
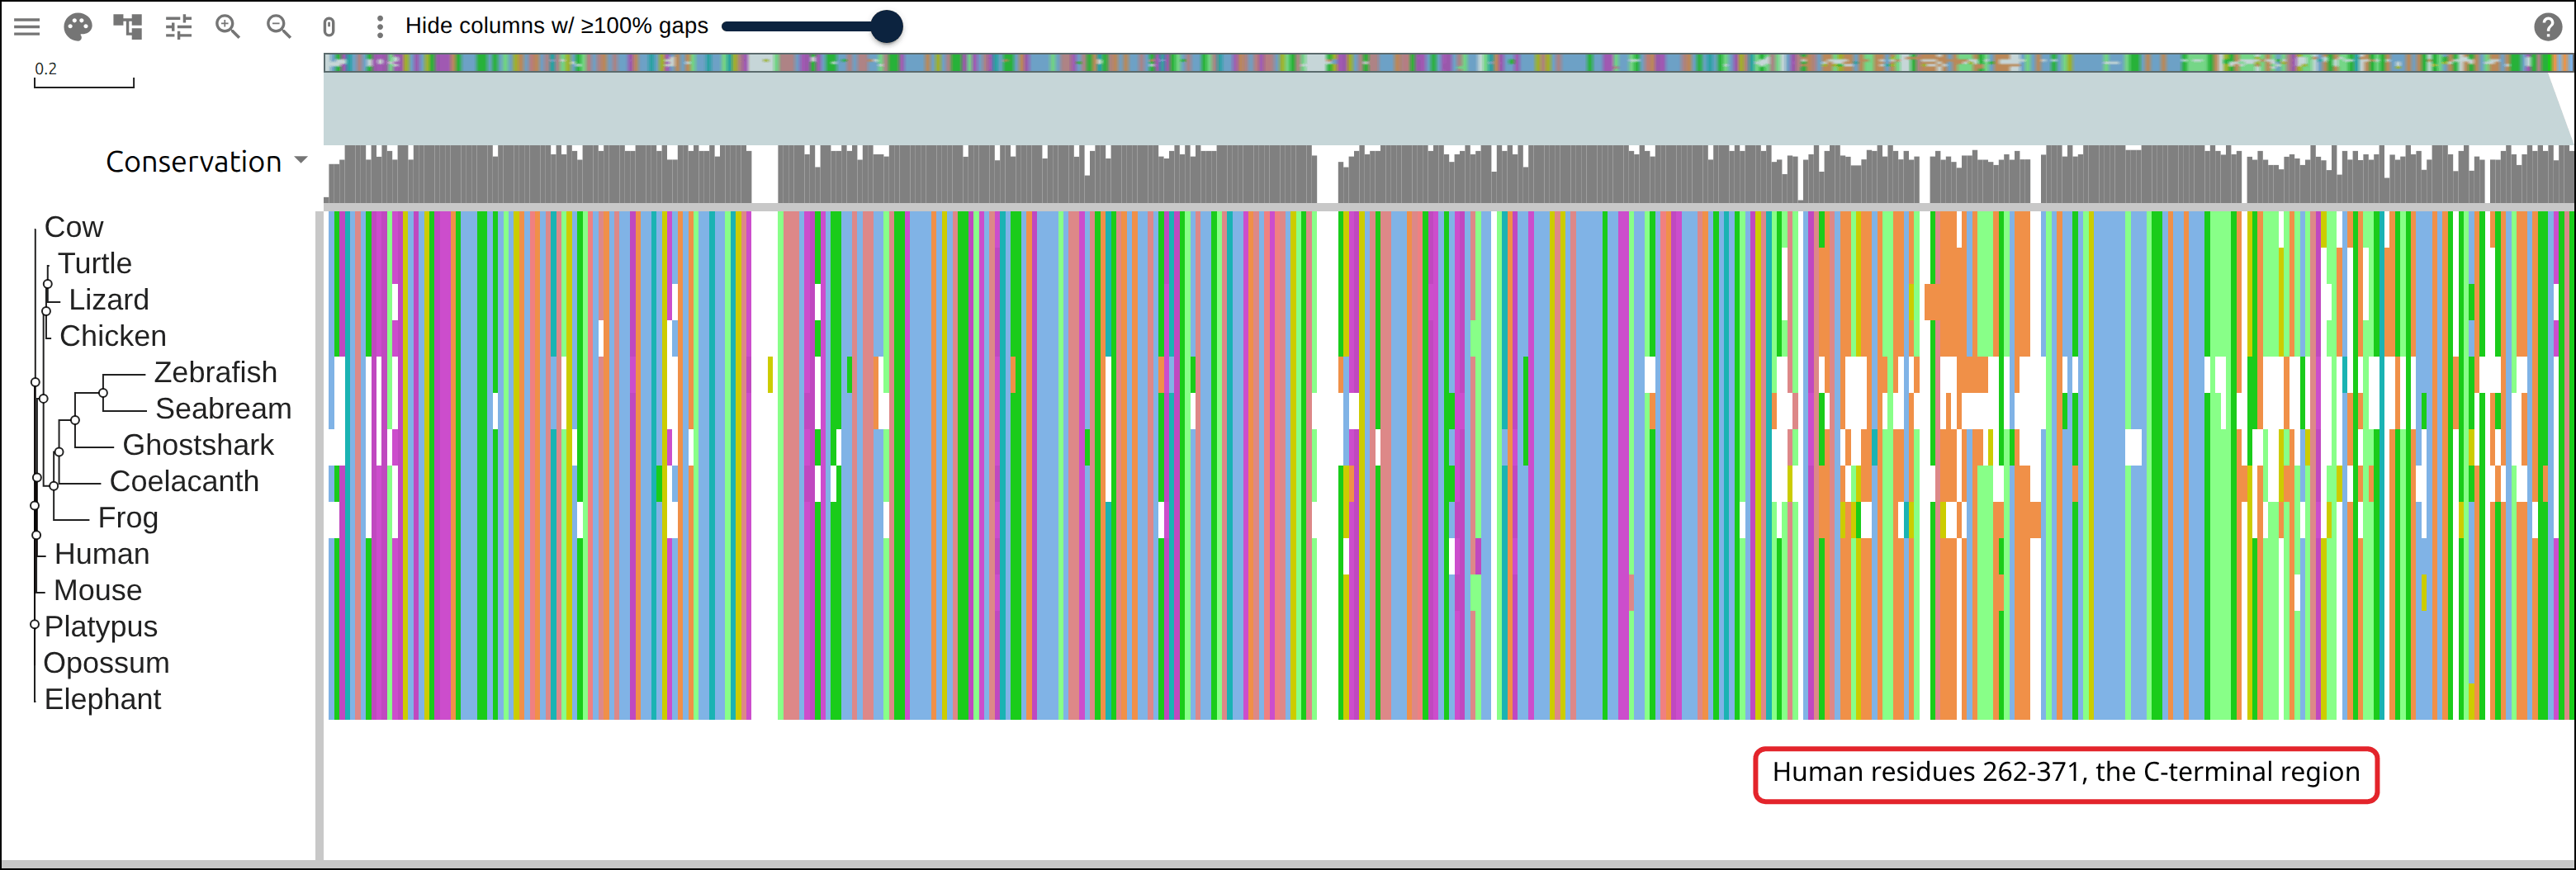
14 rows, 431 columns
(((((Human:0.01799,((Chicken:0.01026,(Turtle:0.00330,Lizard:0.02575):0.00303):0.00546,
(Frog:0.07202,(Coelacanth:0.08469,((Zebrafish:0.08572,Seabream:0.08841):0.05655,
Ghostshark:0.07870):0.03228):0.01066):0.02077):0.01299):0.00134,Mouse:0.01773):0.00213,
Cow:0.00108):0.00132,Platypus:0.00236):0.00000,Elephant:0.00238,Opossum:0.00000);The mammal rows sit on branches of 0.001 to 0.02 substitutions per site, and neighbor joining places Human beside the sauropsids on those distances. The two teleosts and the chimaera carry the long branches.
4. Read the pLDDT off the models#
The API record for an accession names the model files. It answers a request with
no User-Agent header with a 403, so send one:
url=$(curl -sf -A "$UA" "https://alphafold.ebi.ac.uk/api/prediction/Q13148" |
  python3 -c 'import json,sys; print(json.load(sys.stdin)[0]["pdbUrl"])')
curl -sf -A "$UA" "$url" -o models/Q13148.pdb
The pLDDT of a residue is the B-factor of its CA atom, and the same line carries the residue name, so one pass over the file reads the model’s sequence and its confidence together:
def read_model(path):
    seq, plddt = '', []
    for line in open(path):
        if line.startswith('ATOM') and line[12:16].strip() == 'CA':
            seq += THREE_TO_ONE[line[17:20]]
            plddt.append(float(line[60:66]))
    return seq, plddt
A model is built from the UniProt sequence of the day it was made, so the script compares it to the row letter by letter before reading a position off either:
  Human        Q13148       model 414 aa matches the row, mean pLDDT  65.2, 156 residues under 50
  Mouse        Q921F2       model 414 aa matches the row, mean pLDDT  63.8, 162 residues under 50
  Cow          G3MX91       model 414 aa matches the row, mean pLDDT  61.6, 172 residues under 50
  Elephant     G3TD75       model 414 aa matches the row, mean pLDDT  62.0, 178 residues under 50
  Opossum      A0A5F8GU32   model 414 aa matches the row, mean pLDDT  62.4, 169 residues under 50
  Platypus     F7EDX1       model 414 aa matches the row, mean pLDDT  61.9, 175 residues under 50
  Chicken      Q5ZLN5       model 414 aa matches the row, mean pLDDT  65.8, 155 residues under 50
  Turtle       K7FJ67       model 414 aa matches the row, mean pLDDT  61.4, 175 residues under 50
  Lizard       A0A670IXJ6   model 415 aa matches the row, mean pLDDT  62.3, 173 residues under 50
  Frog         Q28F51       model 409 aa matches the row, mean pLDDT  66.5, 156 residues under 50
  Coelacanth   H3BC22       model 412 aa matches the row, mean pLDDT  61.5, 167 residues under 50
  Zebrafish    Q802C7       model 412 aa matches the row, mean pLDDT  65.9, 149 residues under 50
  Seabream     A0A671WI33   model 406 aa matches the row, mean pLDDT  61.6, 170 residues under 50
  Ghostshark   A0A4W3GN84   model 404 aa matches the row, mean pLDDT  62.0, 172 residues under 50
Every model matches, and each one scores 149 to 178 of its residues under 50.
The column track is the mean over the rows that carry a residue in a column,
rounded to an integer, with a second text track giving each column the band
AlphaFold DB colors its models by: V above 90, C from 70 to 90, L from 50
to 70, D below 50.
means = [round(sum(values) / len(values)) for values in by_column]
bands = ''.join(band(m) for m in means)
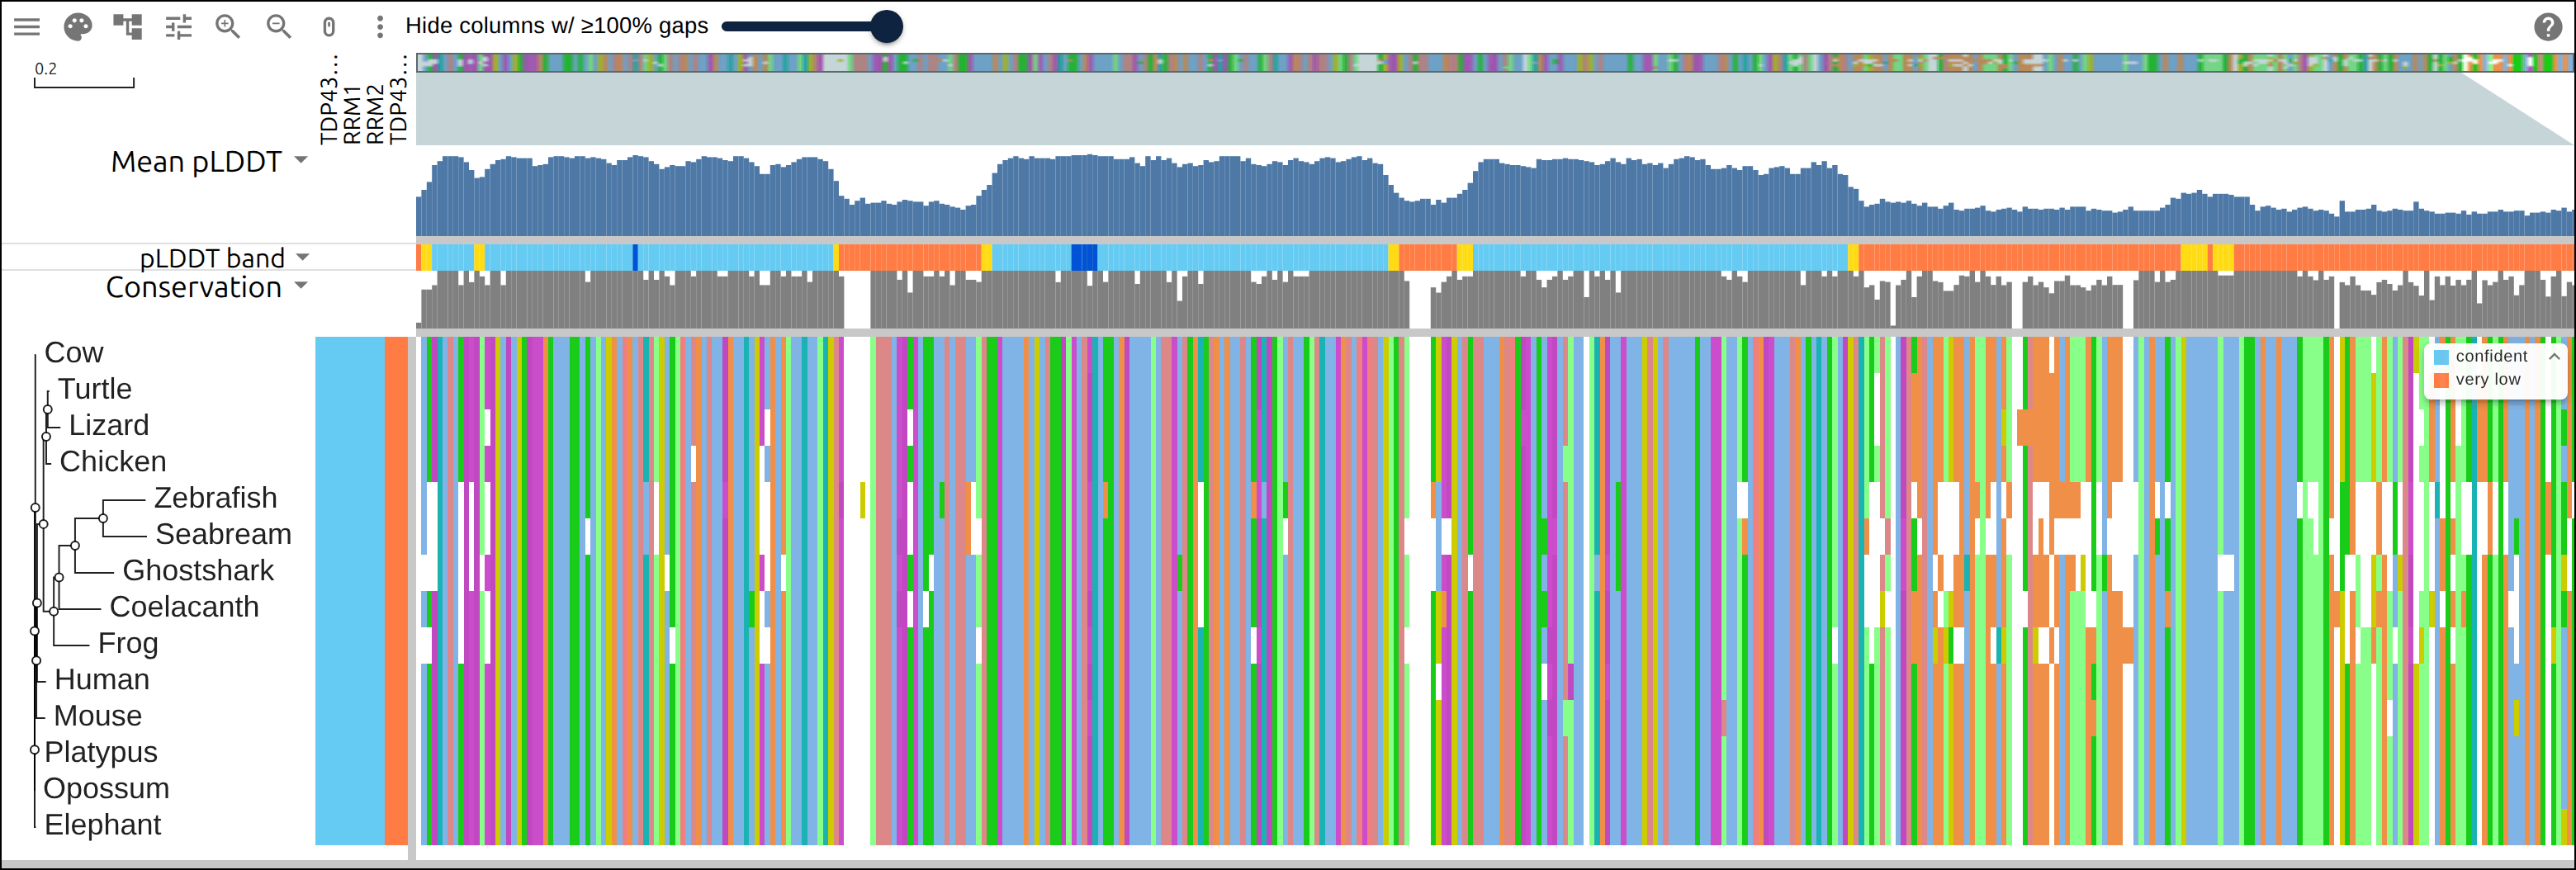
columns by mean pLDDT band: 6 very high, 214 confident, 24 low, 187 very low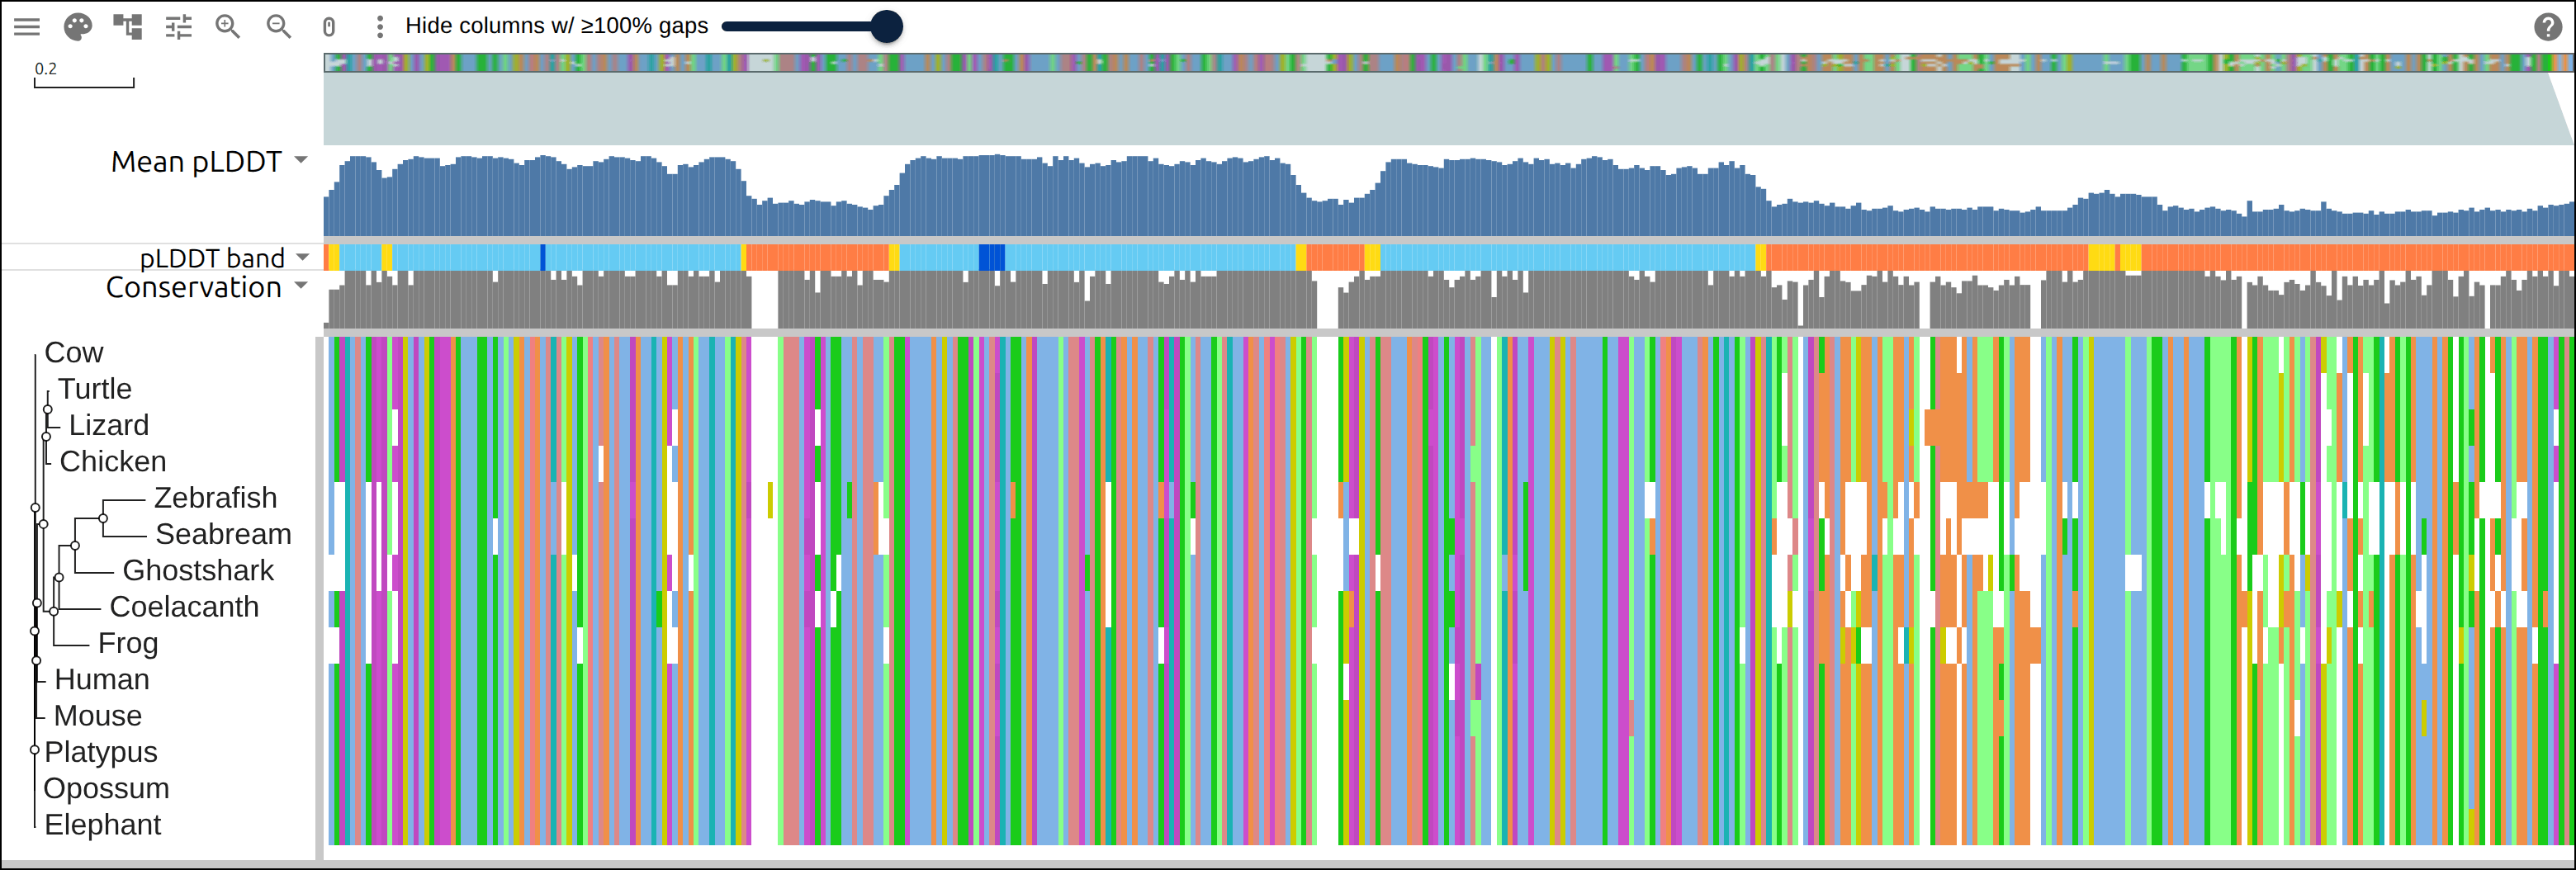
5. Where the Pfam domains fall#
The Pfam matches of the human sequence name its domains, and InterPro serves them for one accession in one request:
curl -sf https://www.ebi.ac.uk/interpro/api/entry/pfam/protein/uniprot/Q13148 \
  -o tardbp-pfam.json
Each match becomes a highlight on the Human row, in that row’s own residue numbering:
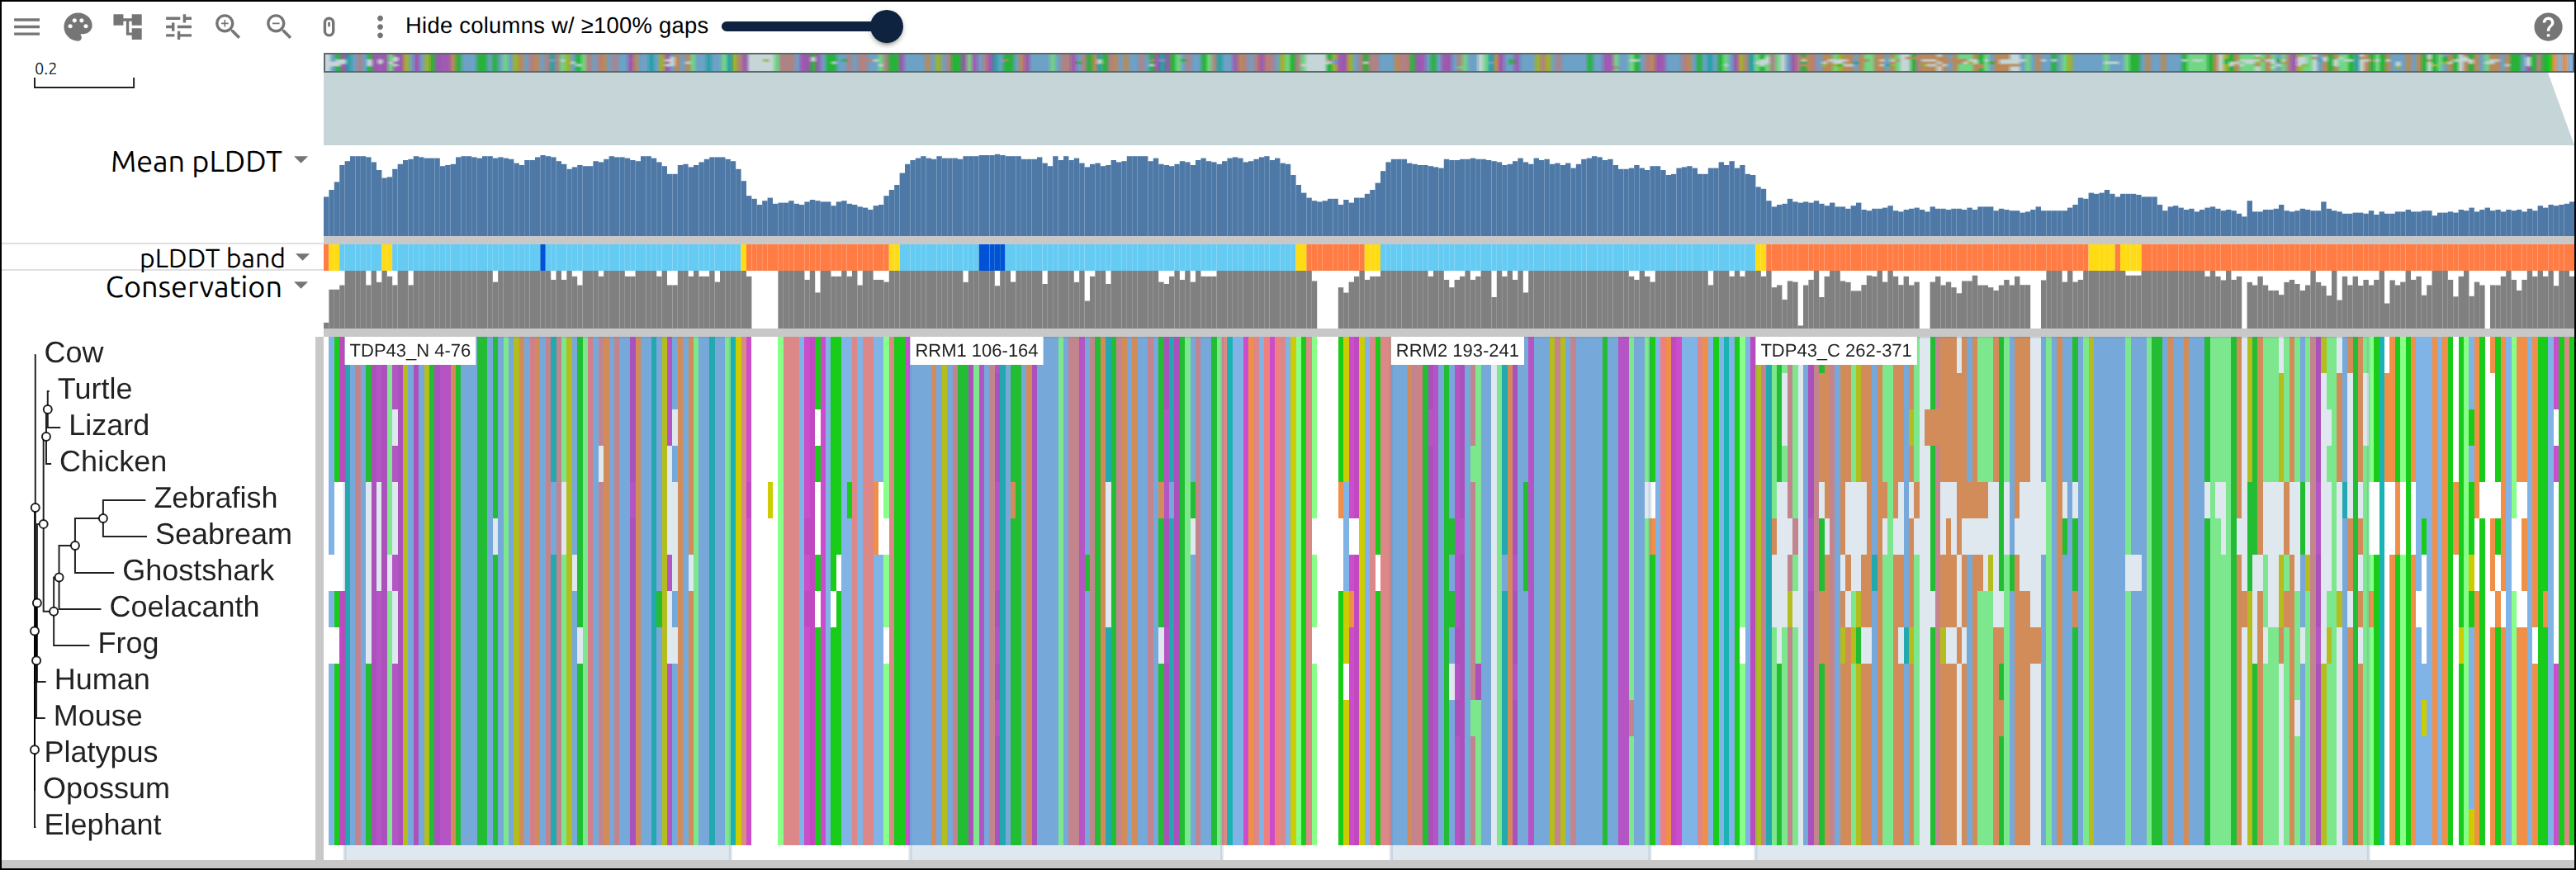
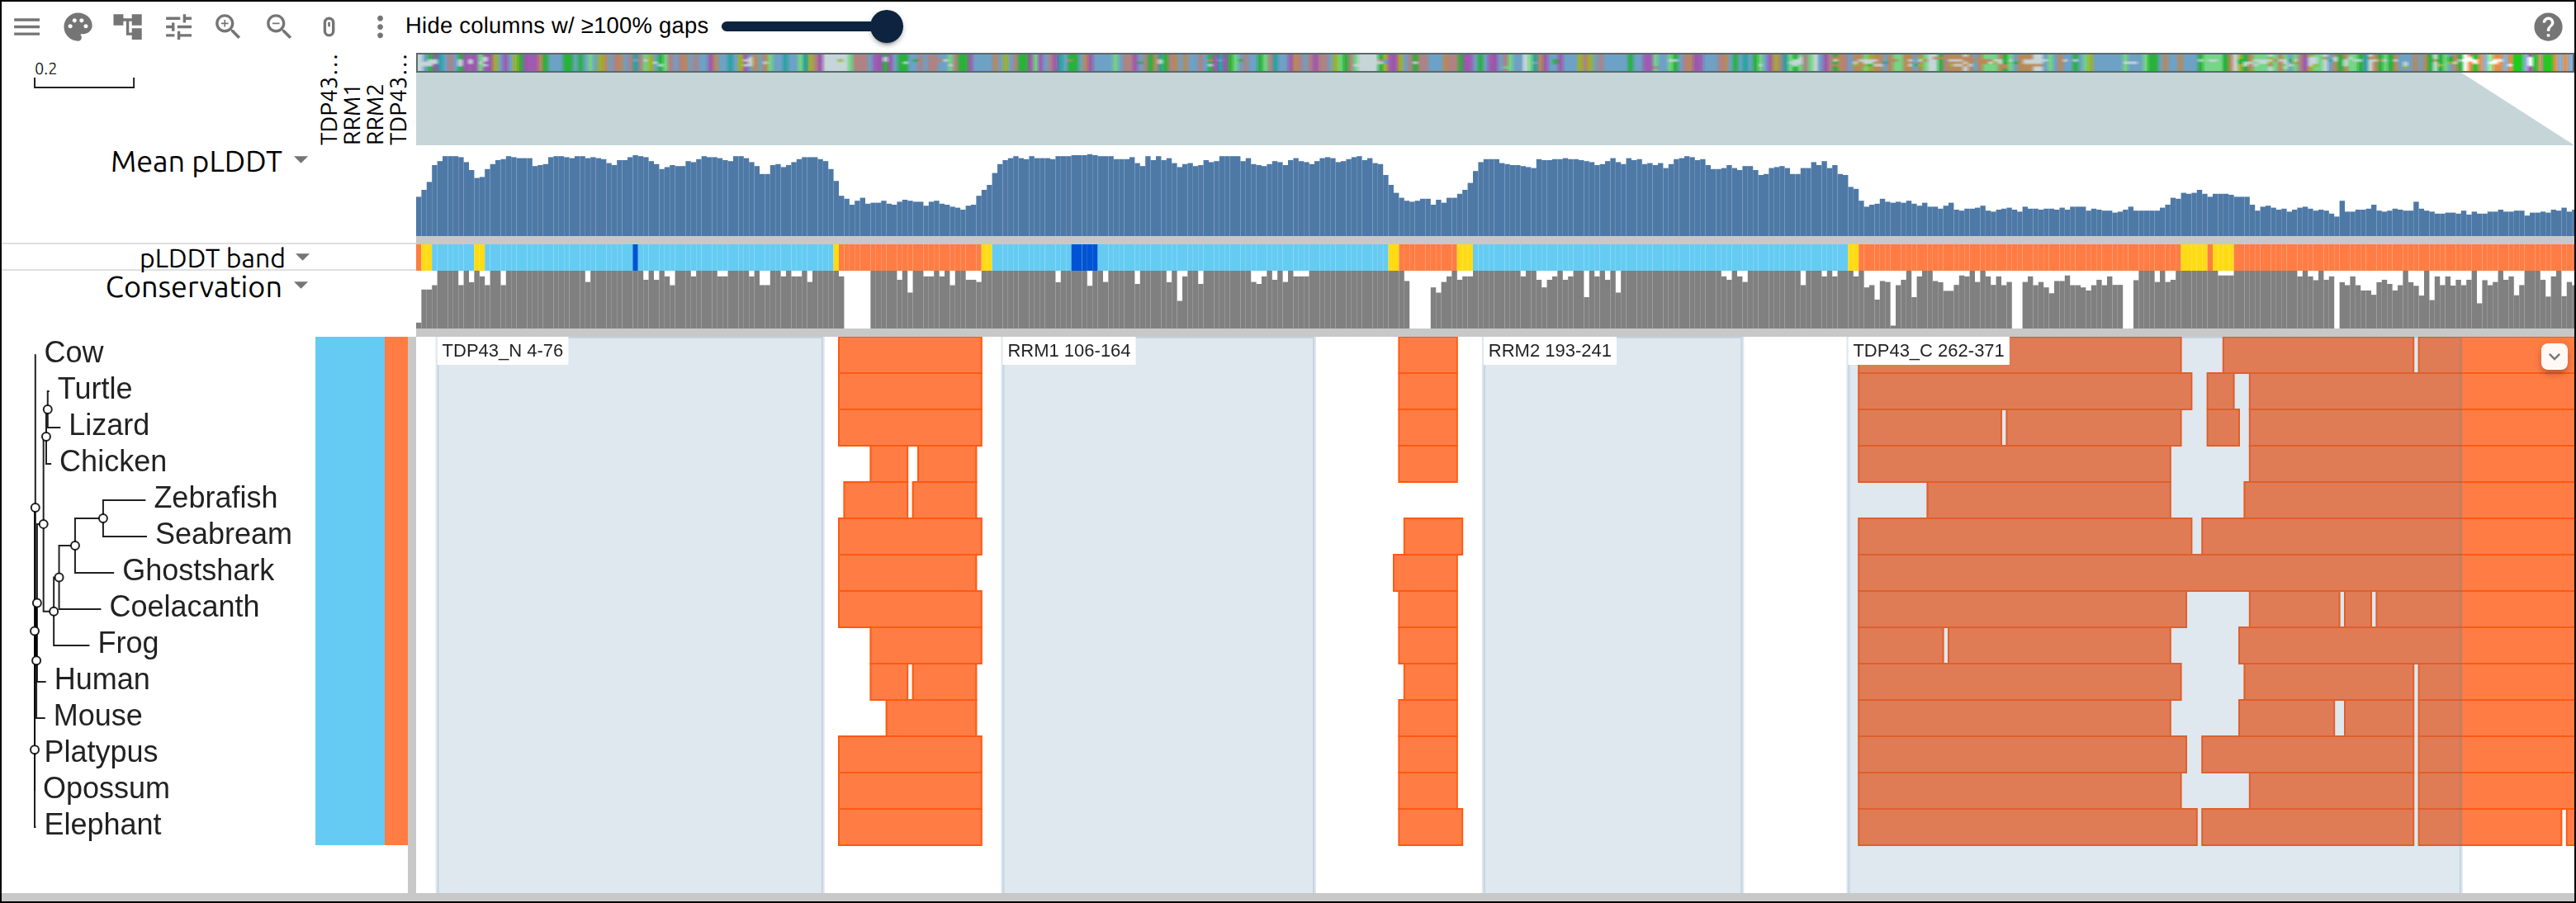
TDP43_N  PF18694 Human 4-76: columns 5-77, mean pLDDT  84.0
RRM1     PF00076 Human 106-164: columns 112-170, mean pLDDT  85.5
RRM2     PF00076 Human 193-241: columns 203-251, mean pLDDT  82.7
TDP43_C  PF20910 Human 262-371: columns 272-387, mean pLDDT  38.4
The N-terminal domain and the two RNA recognition motifs land on the three high blocks, each with a mean above 82. PF20910 covers the C-terminal region, where the mean is 38.4.
6. Each row’s own low-confidence runs#
The mean is one number over fourteen models, so each model’s own runs under 50 go into a GFF in that row’s residue numbering, five residues and longer:
gff.write(f'{label}\tAlphaFold\tpolypeptide_region\t{start + 1}\t{i}\t.\t.\t.\t'
          f'Name=pLDDT<50;color=%23ff7d45\n')
71 runs of 5 or more residues under pLDDT 50 across the 14 rows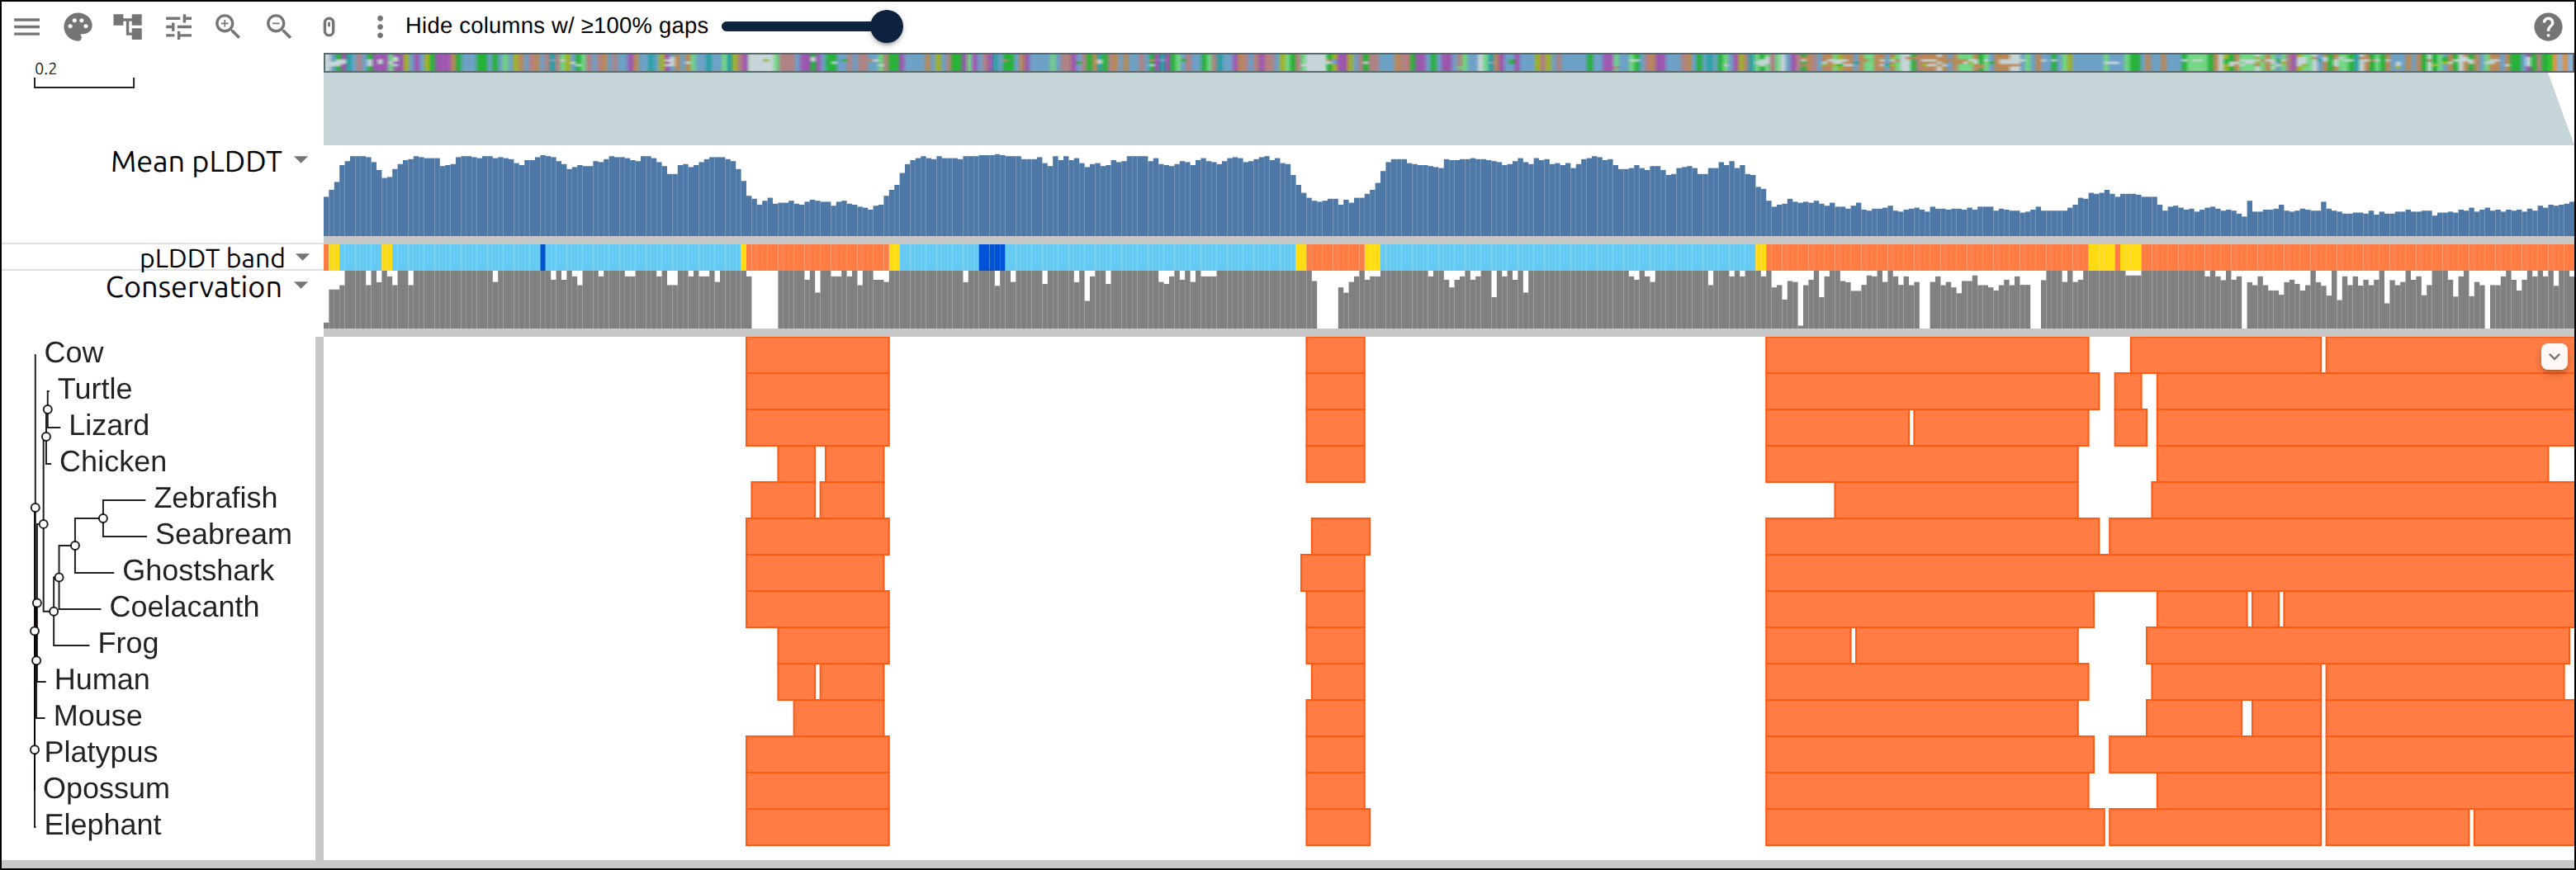
7. One band per row per domain#
A row panel puts the same reading on the row scale. For each row the script takes the mean over the columns a Pfam domain spans and writes the band it falls in, one field per domain:
{
  "Human": {
    "TDP43_N": "confident",
    "RRM1": "confident",
    "TDP43_C": "very low"
  }
}
TDP43_N 14 rows confident
RRM1 14 rows confident
RRM2 14 rows confident
TDP43_C 14 rows very lowFour strip panels read those fields, each through the same map from band name
to AlphaFold DB’s color, so the four columns list one legend:
"rowPanels": [
  {
    "kind": "strip",
    "field": "RRM1",
    "legend": "pLDDT band",
    "scale": { "map": { "confident": "#65cbf3", "very low": "#ff7d45" } }
  }
]
8. Check it against the models#
The script prints the residue and the pLDDT every row carries at one column inside RRM1 and one inside the C-terminal region, read from the B-factor column of each model file:
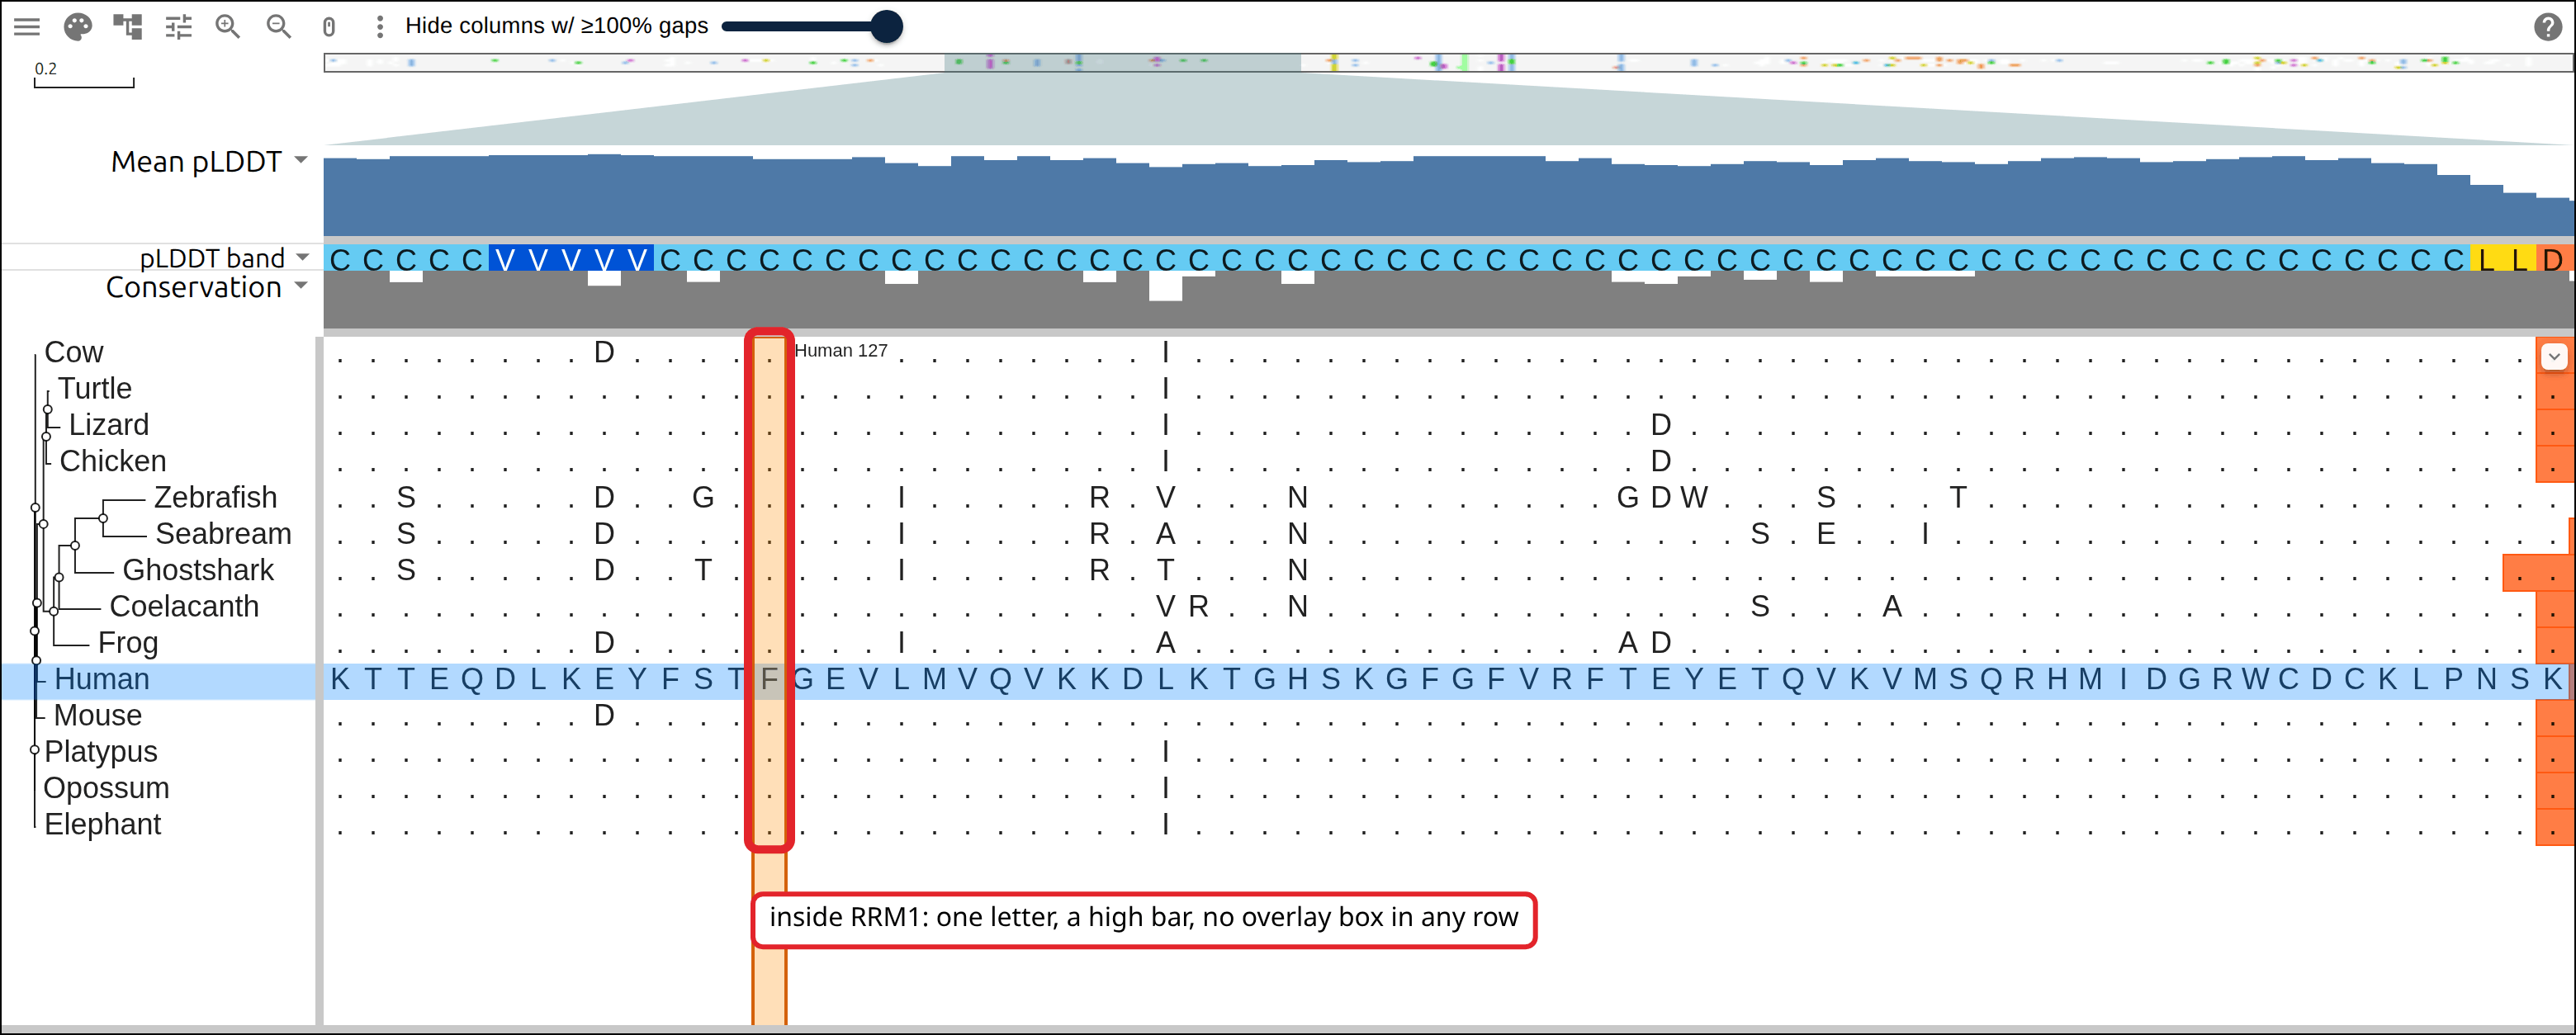
RRM1, alignment column 133 (Human residue 127):
  Human        F  86.4
  Mouse        F  87.6
  Cow          F  84.4
  Elephant     F  85.2
  Opossum      F  84.9
  Platypus     F  85.1
  Chicken      F  87.9
  Turtle       F  84.8
  Lizard       F  85.5
  Frog         F  88.2
  Coelacanth   F  82.8
  Zebrafish    F  87.3
  Seabream     F  82.4
  Ghostshark   F  85.2
TDP43_C, alignment column 316 (Human residue 303):
  Human        Q  47.4
  Mouse        Q  40.7
  Cow          Q  31.6
  Elephant     Q  30.5
  Opossum      Q  33.3
  Platypus     Q  32.8
  Chicken      Q  45.2
  Turtle       Q  31.9
  Lizard       Q  32.9
  Frog         Q  46.6
  Coelacanth   Q  34.5
  Zebrafish    S  39.3
  Seabream     T  30.9
  Ghostshark   P  48.8
Column 133 is phenylalanine in all fourteen rows and scores 82.4 to 88.2. Column 316 scores 30.5 to 48.8, and three rows carry a different residue there.
One stretch of the C-terminal region rises out of the very low band:
inside TDP43_C, columns 335-339 rise to a mean of 52, which is Human residues 320-324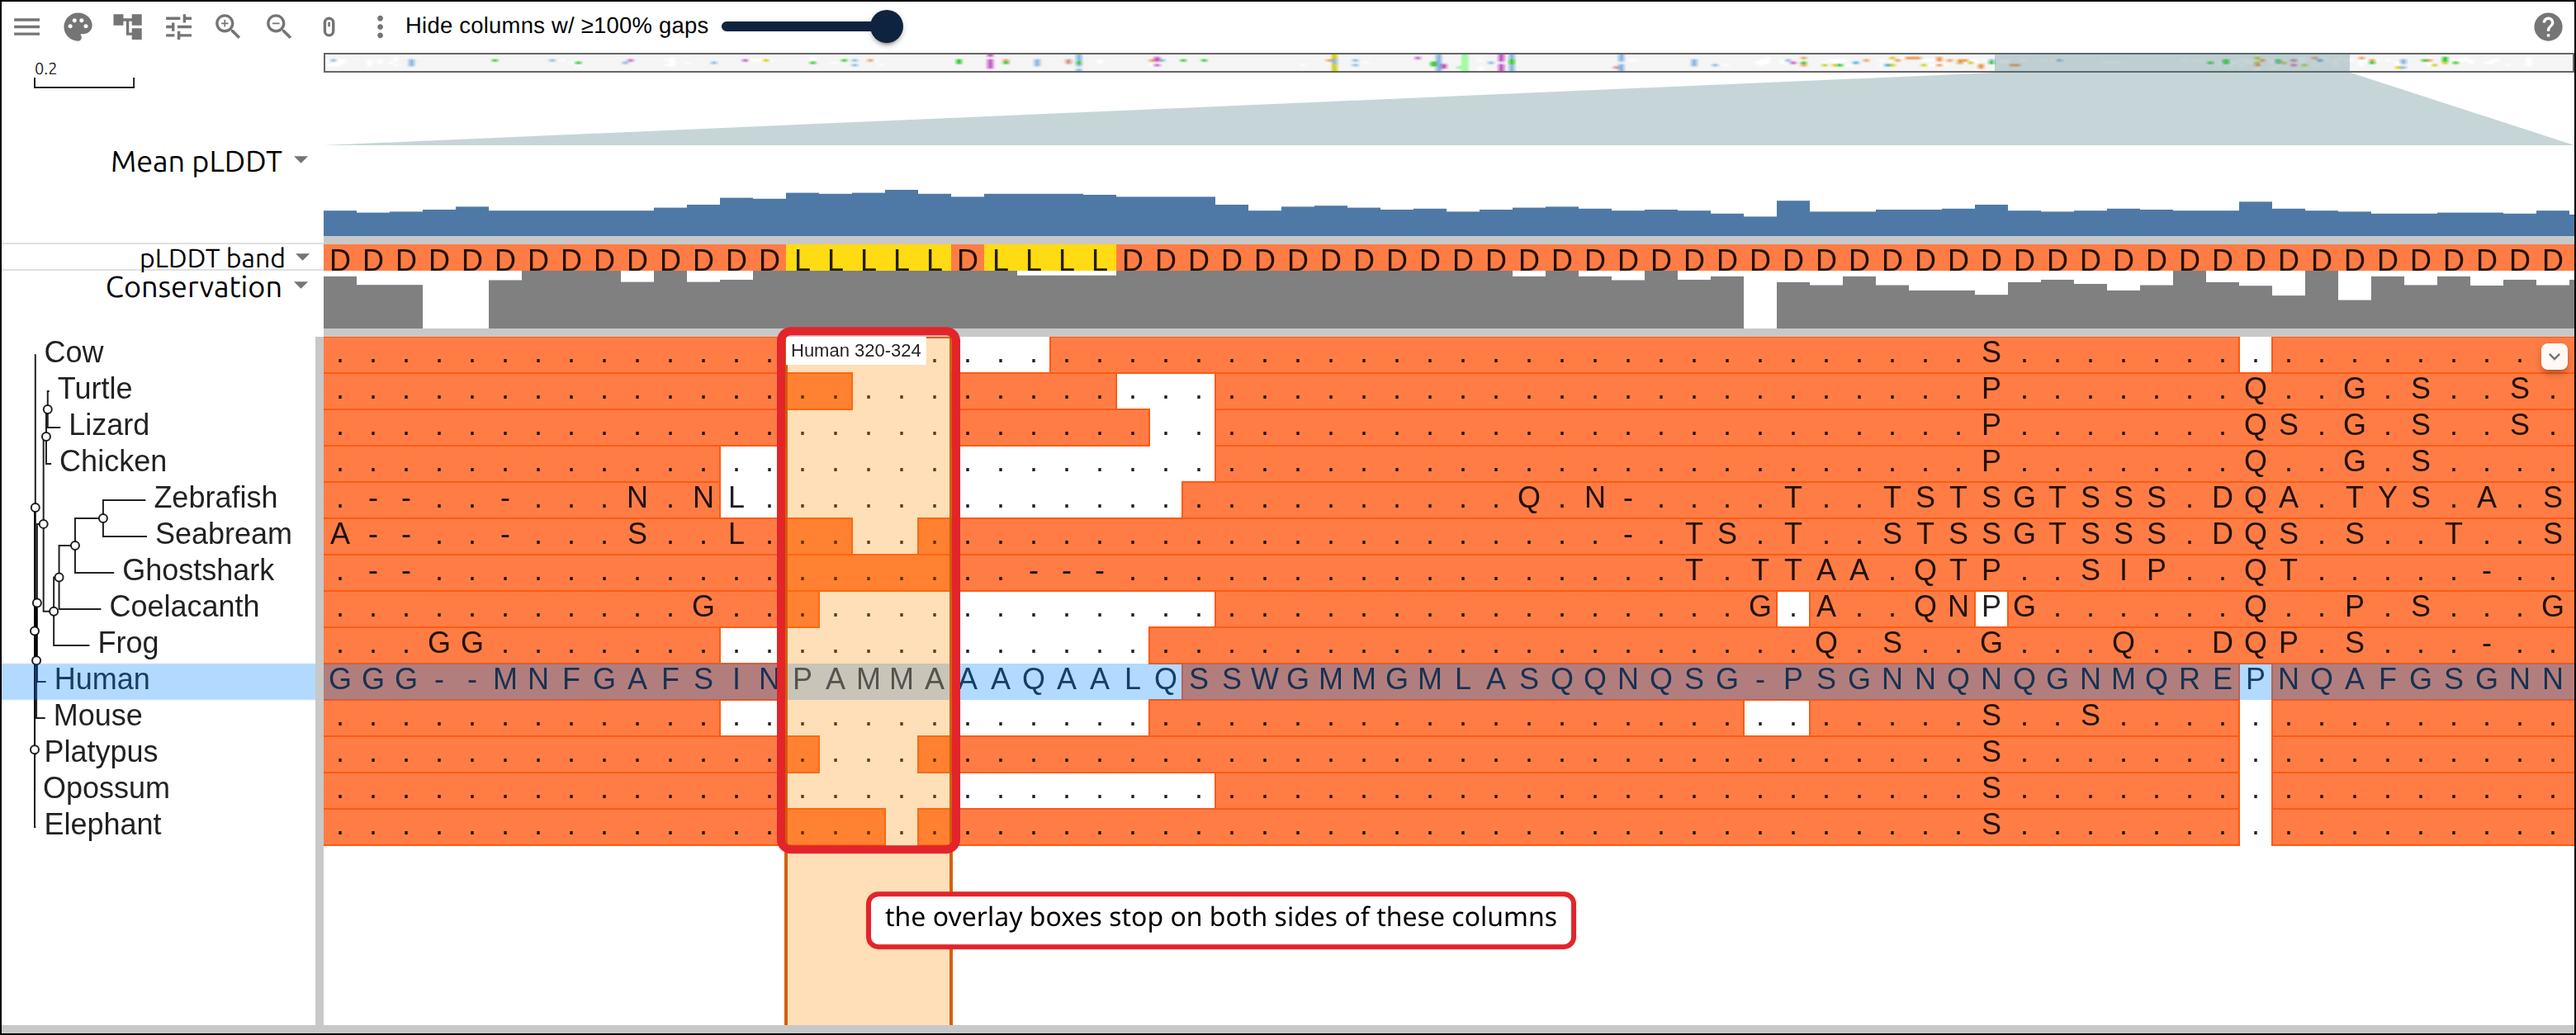
9. Open the whole thing#
The view combines four hosted files and three layers. The files go behind URLs, and the tracks, the highlights and the row panels go in the link:
{
  "msaview": {
    "type": "MsaView",
    "colWidth": 3.2,
    "rowHeight": 22,
    "colorSchemeName": "clustalx_protein_dynamic",
    "msaFilehandle": { "uri": "https://example.org/tardbp.afa" },
    "treeFilehandle": { "uri": "https://example.org/tardbp.nwk" },
    "gffFilehandle": { "uri": "https://example.org/tardbp-lowconf.gff" },
    "treeMetadataFilehandle": {
      "uri": "https://example.org/tardbp-rowdata.json"
    }
  }
}
Add the columnTracks, highlights and rowPanels entries from
tardbp-layers.json beside those, URL-encode the whole object, and hang it off
the app as #data=. The two tracks and the four strips come to about 5,400
characters encoded.
Reproduce it end to end#
curl -O https://raw.githubusercontent.com/GMOD/JBrowseMSA/main/docs/tutorials/scripts/build_alphafold_confidence.sh
bash build_alphafold_confidence.sh
With no arguments the script writes the row table above and builds every file beside it, printing every number on this page. Pass your own table of labels and UniProt accessions to do the same for another family:
bash build_alphafold_confidence.sh my-rows.tsv out/The reference row is the first Human line, and the Pfam short names in the
script’s SHORT map name the domains the highlights and the strips carry.
See also#
- Data layers
- Reading variant effect predictions on p53
- Hemoglobin’s two subunits and the interfaces between them
- User guide
References#
- Jumper J, Evans R, Pritzel A, et al. Highly accurate protein structure prediction with AlphaFold. Nature 596:583-589.
- Tunyasuvunakool K, Adler J, Wu Z, et al. Highly accurate protein structure prediction for the human proteome. Nature 596:590-596.
- Varadi M, Anyango S, Deshpande M, et al. AlphaFold Protein Structure Database: massively expanding the structural coverage of protein-sequence space with high-accuracy models. Nucleic Acids Res 50:D439-D444.
- Conicella AE, Zerze GH, Mittal J, Fawzi NL. ALS mutations disrupt phase separation mediated by alpha-helical structure in the TDP-43 low-complexity C-terminal domain. Structure 24:1537-1549.
- Lukavsky PJ, Daujotyte D, Tollervey JR, et al. Molecular basis of UG-rich RNA recognition by the human splicing factor TDP-43. Nat Struct Mol Biol 20:1443-1449.
- Thompson JD, Higgins DG, Gibson TJ. CLUSTAL W: improving the sensitivity of progressive multiple sequence alignment through sequence weighting, position-specific gap penalties and weight matrix choice. Nucleic Acids Res 22:4673-4680.