msaview-widget
A notebook widget for react-msaview: a
multiple sequence alignment beside its phylogenetic tree, in JupyterLab, Jupyter
Notebook, VS Code and any other host anywidget
supports. The distribution is msaview-widget and the import is msaview,
because the name msaview on PyPI belongs to another project.
Install#
The wheel ships the widget’s JavaScript, which a checkout builds first:
pnpm install
pnpm --filter msaview-widget build
pip install packages/python
Quick start#
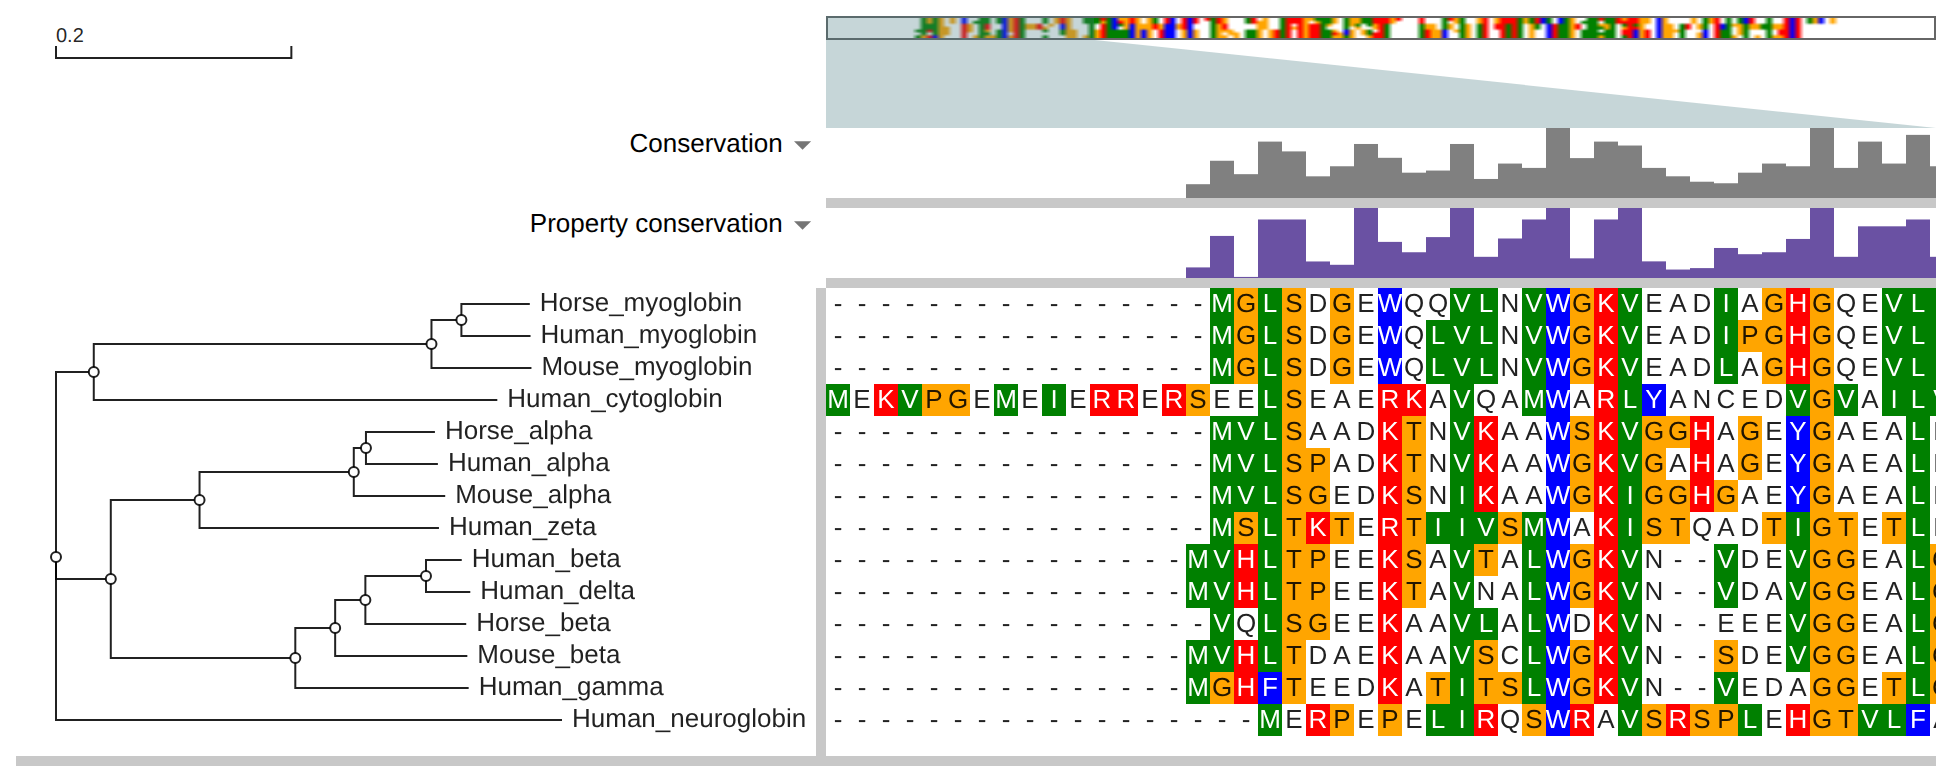
from msaview import MSAView

view = MSAView(msa="globin.aln", tree="globin.nh", hide_header=True)
view
Setting a trait updates the widget in place and keeps its scroll and zoom:
view.color_scheme = "clustal"
view.highlights = [{"row": "Human_beta", "start": 64, "end": 64, "label": "distal His"}]Traits#
The traits are the MSAViewer props in
USAGE.md, in snake
case. highlights and column_tracks take the JSON shapes in
docs/layers.md.
| Trait | Value |
|---|---|
msa, tree, gff | document text or a file path |
msa_url, tree_url, gff_url | a URL the viewer fetches |
color_scheme | a scheme name, such as "clustal", or a dict of residue letter to color |
height | pixels |
col_width, row_height | pixels per column and per row |
highlights | list of {start, end}, {row, start, end} or {rows} |
features | list of {row, start, end, ...} features, or a DataFrame with those columns |
clades | list of {mrca or range, tips, mark} clades of the tree to mark |
highlight_columns | columns (0-based) under a persistent overlay |
residue_mappings | which structure residue each row residue is |
column_tracks | list of bar, text or arc tracks |
row_data | extra fields per row name, such as a lineage or a host |
encodings | {channel, field, scale}: tipLabel, rowTint, branch, featureFill, featureLabel |
row_panels | strip and features panels drawn beside the tree |
relative_to | a row name; other rows draw as their differences from it |
region | {start, end} columns or {row, start, end} residues |
selection | the selected block, {start, end} columns and optional rows names (see below) |
allowed_gappyness | hide columns at least this percent gaps (default 100) |
draw_tree, show_branch_len | booleans, default True |
tree_order | "branchLength" (default), "input", "ladderize" or "ladderizeReverse" |
tree_root | "midpoint", or outgroup tip names: one name or a list |
tree_area_width | pixels; auto_tree_area_width sizes it to the labels |
residue_encoding | "fill" (default) paints the cell; "color" paints the letter |
hide_header | boolean, default False |
theme | "auto" (default), "light", "dark" or MUI theme options |
theme="auto" follows JupyterLab’s and Notebook 7’s data-jp-theme-light
attribute, then VS Code’s data-vscode-theme-kind, then the browser’s
prefers-color-scheme, and switches when the host does.
The widget sets three traits from the browser:
clicked: the cell a click pinned,{column, row, residue, letter}, orNoneafter a click clears itviewport: the columns on screen,{startColumn, endColumn}, once a scroll or zoom settlesselection: the block the person selected,{start, end, rows}, once a drag settles, orNoneafter Escape clears it
All three are 1-based. column, start and end count every column of the
alignment, residue counts the clicked row’s own letters, and rows names the
selected rows, absent when the block spans every row. A shift-drag on the
alignment selects a block, and a drag along a track selects columns across every
row. selection is also an input: assigning it selects that block in the
viewer. The widget keeps hover in the browser, since a comm message per pointer
move would flood the kernel.
view.observe(lambda change: print(change["new"]), "clicked")Python inputs#
The package converts only what JSON cannot carry:
msa=takes adictof name to aligned sequence, a BiopythonMultipleSeqAlignment, or aBio.Align.Alignmenttree=takes aBio.Phylotreemsa=,tree=andgff=take apathlib.Pathor a filename string- a column track’s
valuestakes a numpy array or pandas Series, and a NaN in it draws no bar
Examples#
examples/01_quickstart.ipynb
opens the globin alignment from packages/examples/data.
examples/02_entropy_and_clicks.ipynb
draws per-column Shannon entropy as a bar track, highlights the columns above an
ipywidgets slider’s threshold, and prints the letter each row has at a clicked
column.
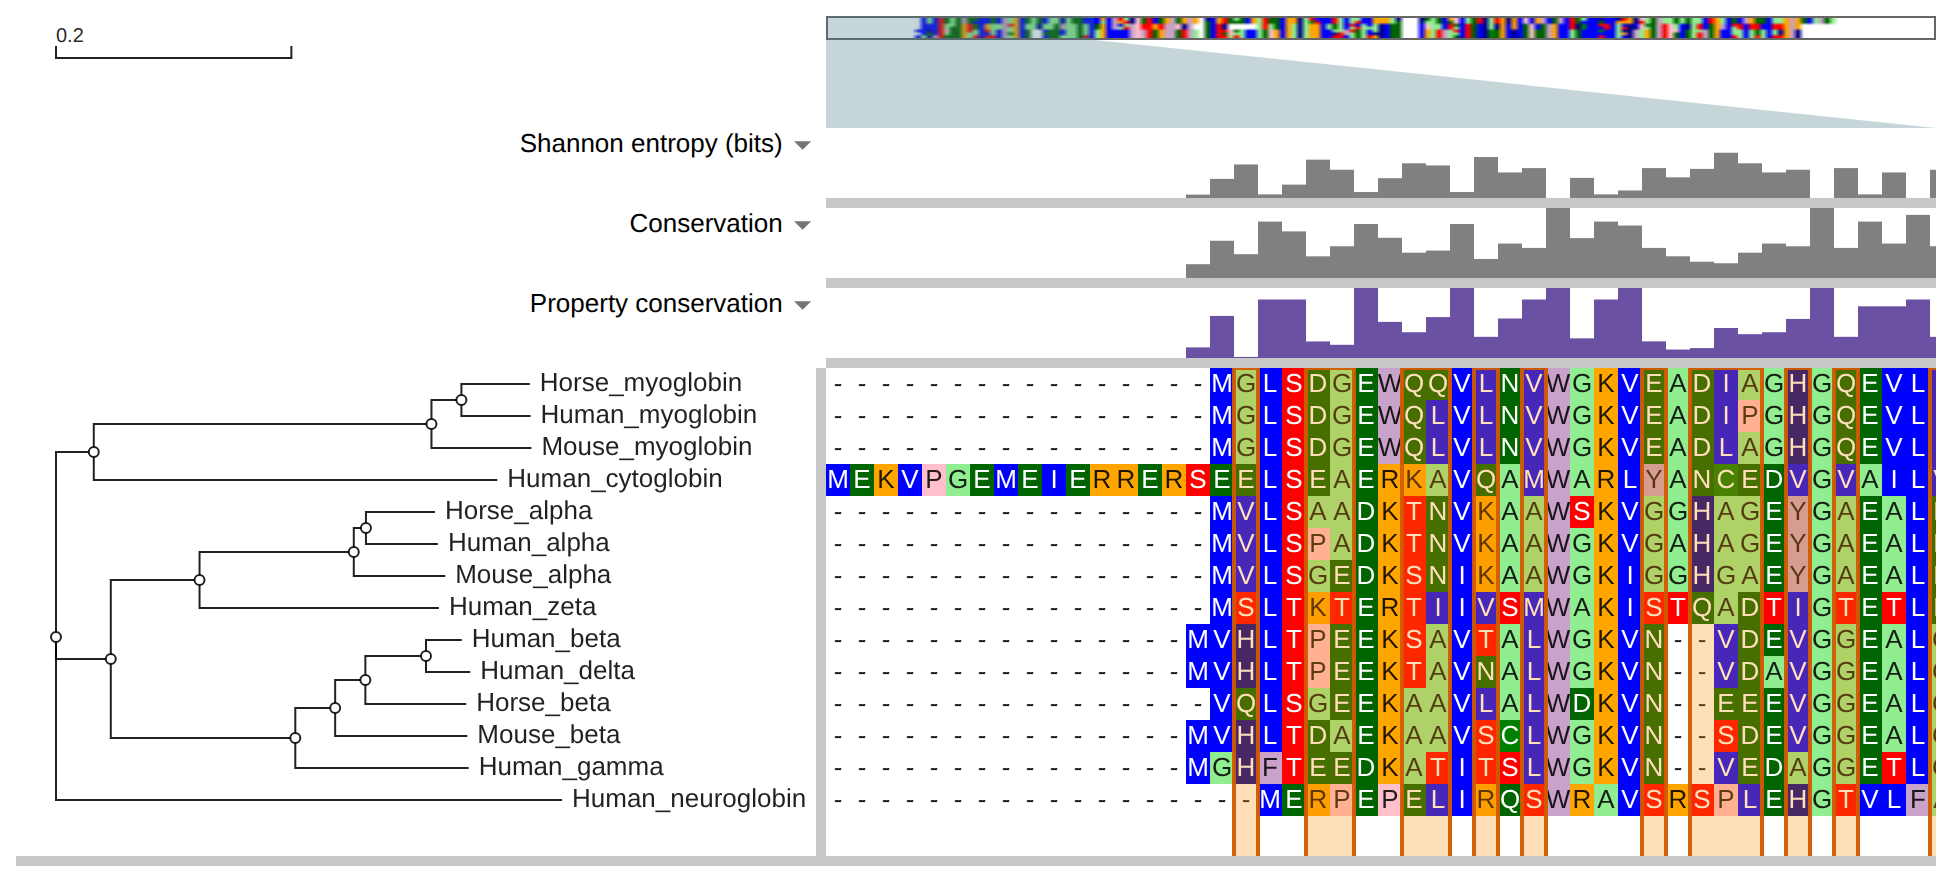
scripts/run_examples.py executes both notebooks in a kernel, and
scripts/screenshot_examples.mjs renders the widgets they built into
docs/media:
pip install -e "packages/python[examples]"
python packages/python/scripts/run_examples.pyDevelopment#
pip install -e "packages/python[dev]"
pytest packages/python/tests
pnpm vitest run packages/python