Coloring an RSV phylogeny by its metadata
A Nextstrain build records a clade call, a country, a collection date and a
world region for every genome it places in its tree.
An RSV phylogeny from a public Nextstrain build
reconstructed an alignment and a tree from one such build and packed four of
those fields into each tip name. This page writes the same fields out as a row
table, loads the table into the viewer, and colors the tip labels, the tree
edges and the rows from it, which is ggtree’s groupClade, aes(color = group)
and geom_hilight done as data the viewer draws.
Prerequisites#
- Python 3, standard library only, nothing to install
- nothing to read along: every figure below links to the live view it captured
Where the data comes from#
The 184-tip subsample of Nextstrain’s RSV-A build, the dataset the phylogeny-at-scale page ends on, plus one file this page adds.
- the auspice JSON every field comes from: https://data.nextstrain.org/rsv_a_genome.json
- the subsampled whole-genome alignment, 184 rows: https://gmod.org/JBrowseMSA/demo/data/scale/rsv-sample.aln
- its tree: https://gmod.org/JBrowseMSA/demo/data/scale/rsv-sample.nh
- the row table this page writes: https://gmod.org/JBrowseMSA/demo/data/scale/rsv-sample-rowdata.json
1. The row table#
Every tip in the auspice JSON carries a node_attrs object, and four of its
entries hold the fields this page draws with:
def fields_for(node_attrs):
    num_date = node_attrs.get("num_date", {}).get("value")
    return {
        "clade": node_attrs.get("clade_membership", {}).get("value", "NA"),
        "country": node_attrs.get("country", {}).get("value", "NA"),
        "region": node_attrs.get("region", {}).get("value", "NA"),
        "year": str(int(num_date)) if num_date is not None else "NA",
    }
A row table is keyed by row name, so the key each record goes under is the tip
label the phylogeny-at-scale build script wrote, accession|clade|country|year.
Both scripts build that label with the same label_for function, so every key
matches a row of the hosted alignment:
python3 build_phylogeny_metadata.py .1840 tips in the build
wrote ./rsv-sample-rowdata.json: 184 rows, 21 kB
clade: 23 distinct values
country: 28 distinct values
region: 7 distinct values
year: 37 distinct values
clade A.D: 38 rows
clade A.D.1: 25 rows
clade A.3.1: 22 rows
clade A.D.3: 13 rows
clade A.3: 12 rowsThe 184 rows of the subsample carry 23 distinct clade calls and 28 countries, and the file holding them is 21 kB. Percent-encoded into a link the table runs past 20,000 characters, so the snapshot names the file instead, which keeps the link short, and the viewer fetches it at startup:
{
  "type": "MsaView",
  "msaFilehandle": { "uri": "data/scale/rsv-sample.aln" },
  "treeFilehandle": { "uri": "data/scale/rsv-sample.nh" },
  "treeMetadataFilehandle": { "uri": "data/scale/rsv-sample-rowdata.json" }
}
2. Tip labels colored by clade#
An encodings record names the channel to paint, the field feeding it and the
scale between them. The tipLabel channel colors the label beside each tip:
"encodings": [{ "channel": "tipLabel", "field": "clade" }]With 23 clade calls in the table, the field runs past the end of every named
palette, so leaving out scale gives each value an evenly spaced hue. The
legend in the top right lists all 23 under the field’s name.
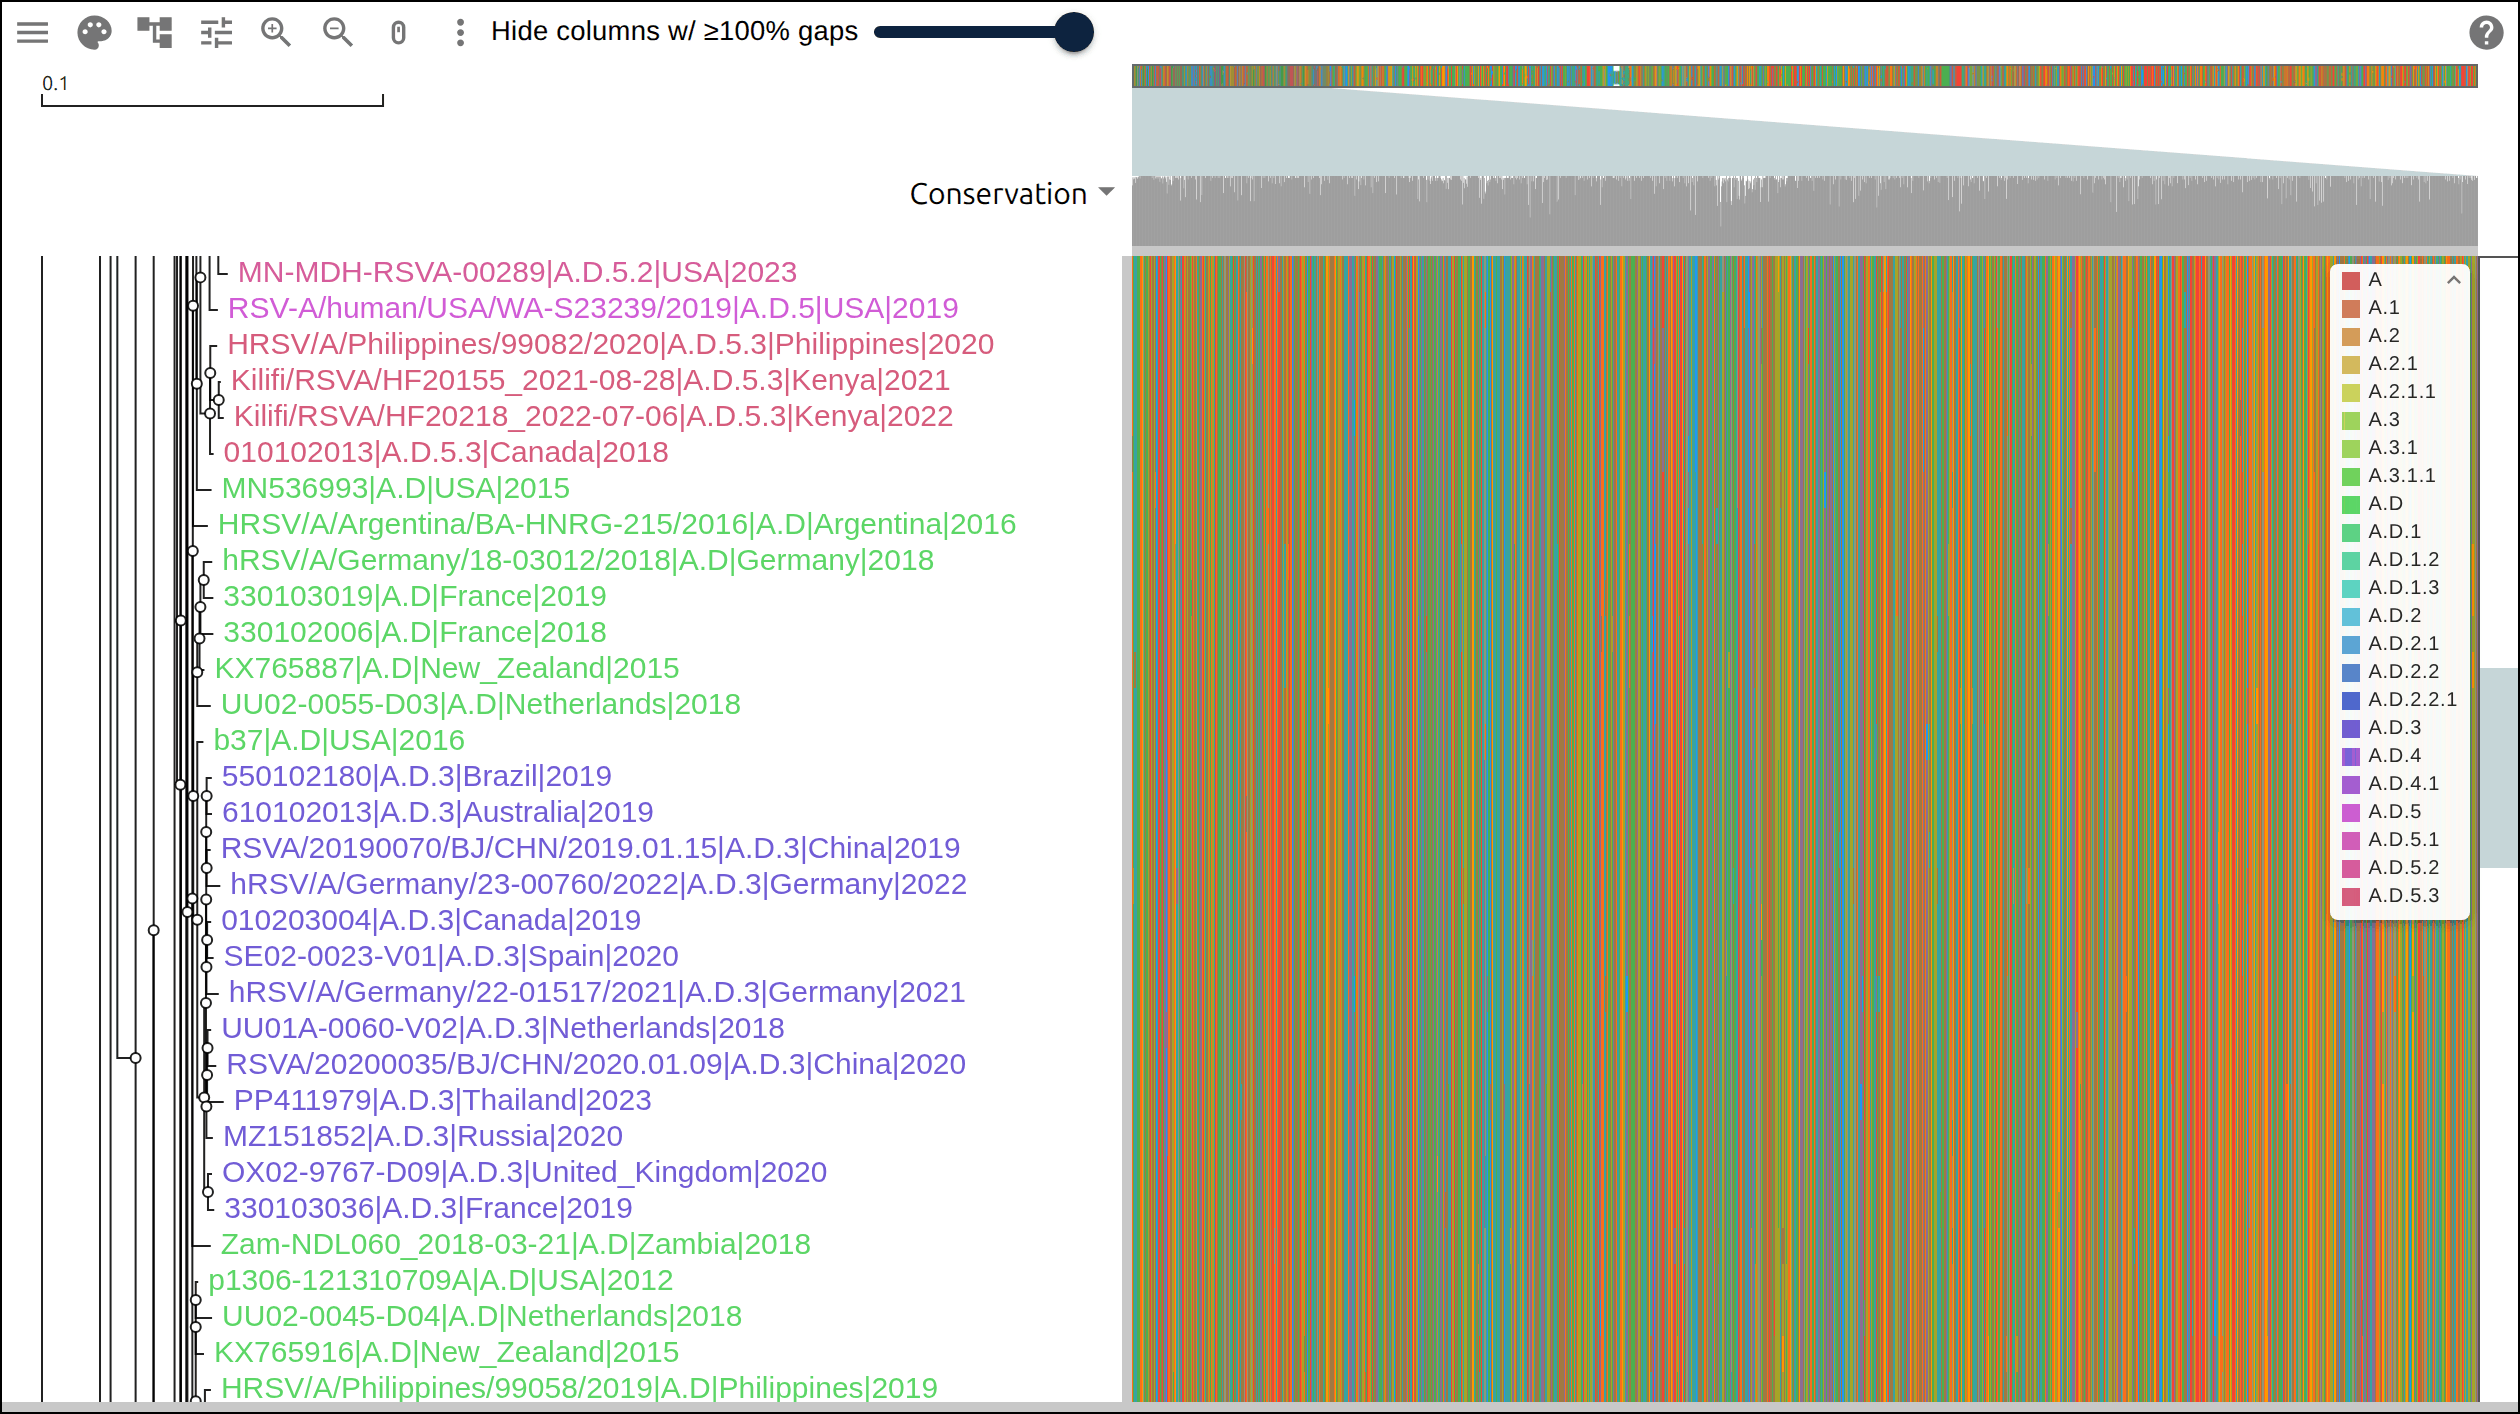
drawLabels: true and a row height of 18, scrolled to
display row 66. The labels turn from green to purple on row 80, where the last
A.D tip gives way to the first A.D.3 tip, and back to green on row 93. The
legend carries one swatch per clade call.3. Branches colored by clade#
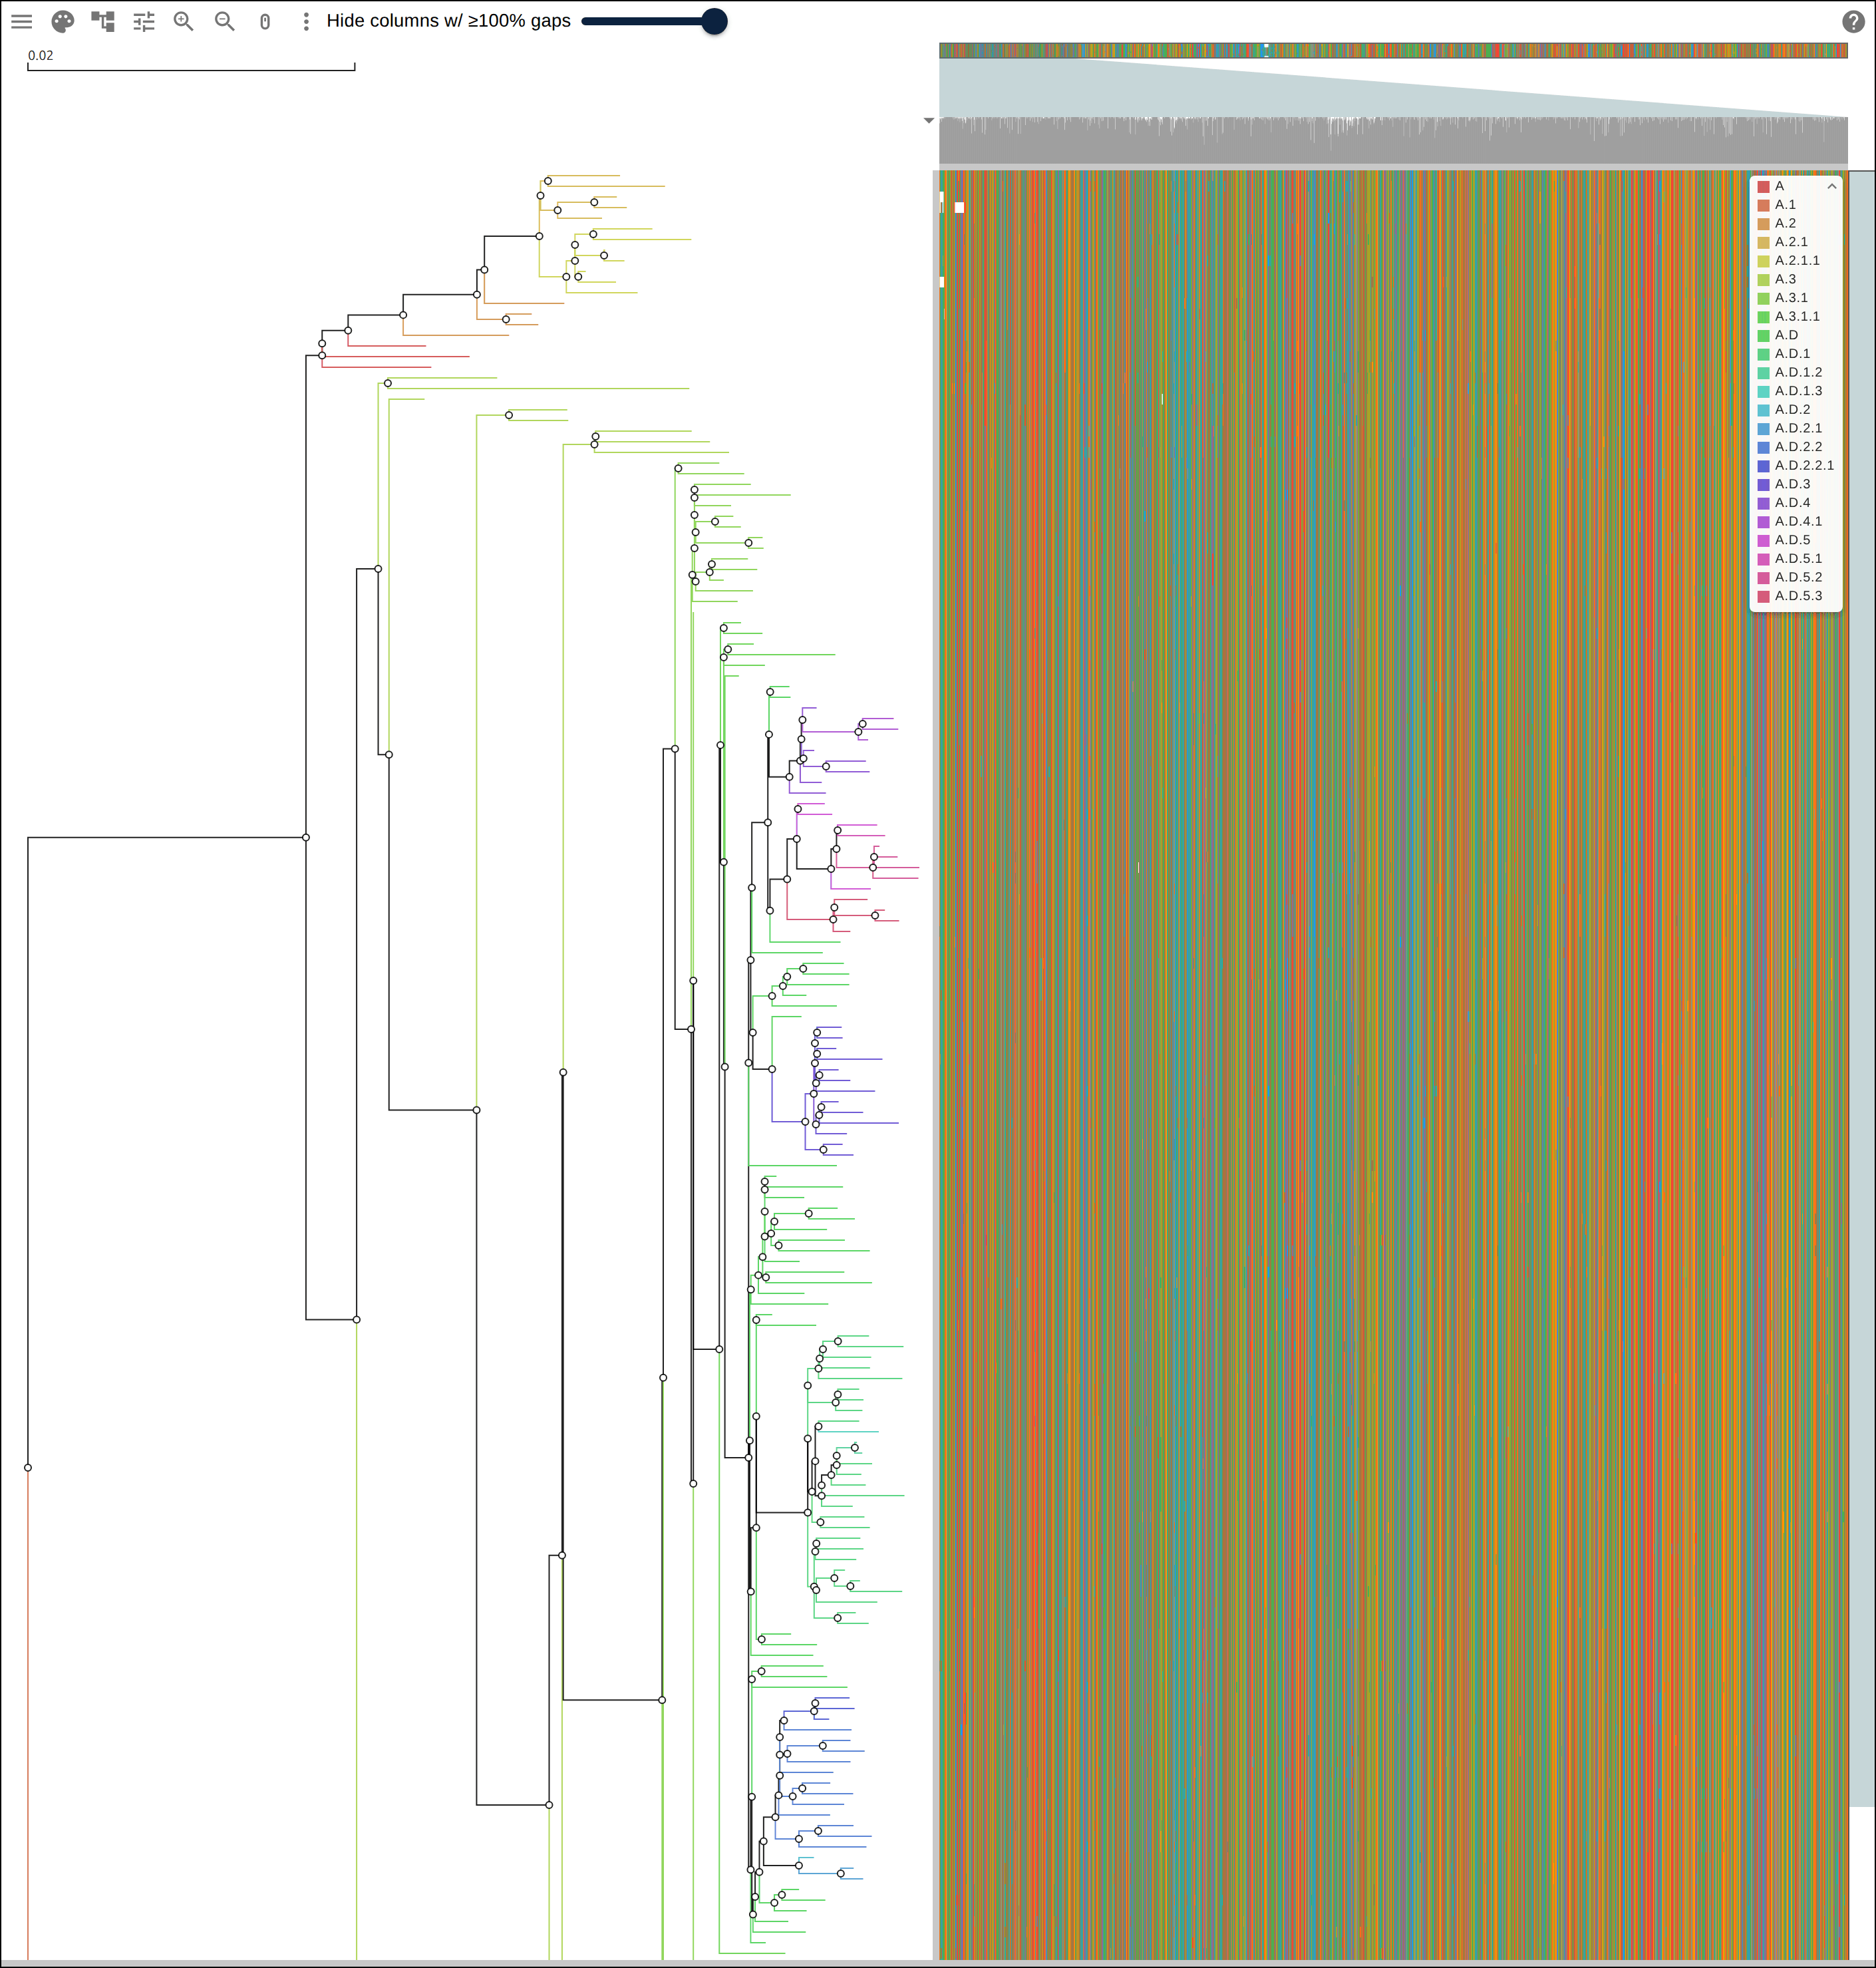
The branch channel gives an internal node the field value its tips agree on
and colors the edge above it. Clade calls nest inside one another, so the tips
under a node agree wherever a single named clade covers them:
"encodings": [{ "channel": "branch", "field": "clade" }]The build script counts the same thing off the tree it pruned:
pruned tree: 184 tips, 363 edges
branch by clade: 293/363 edges colored, 109/179 of them above an internal node
Each of the 184 terminal edges takes a color, since one tip agrees with itself, which leaves the 179 internal edges as the count worth reading: 109 of them take a clade color.
4. Branches colored by country#
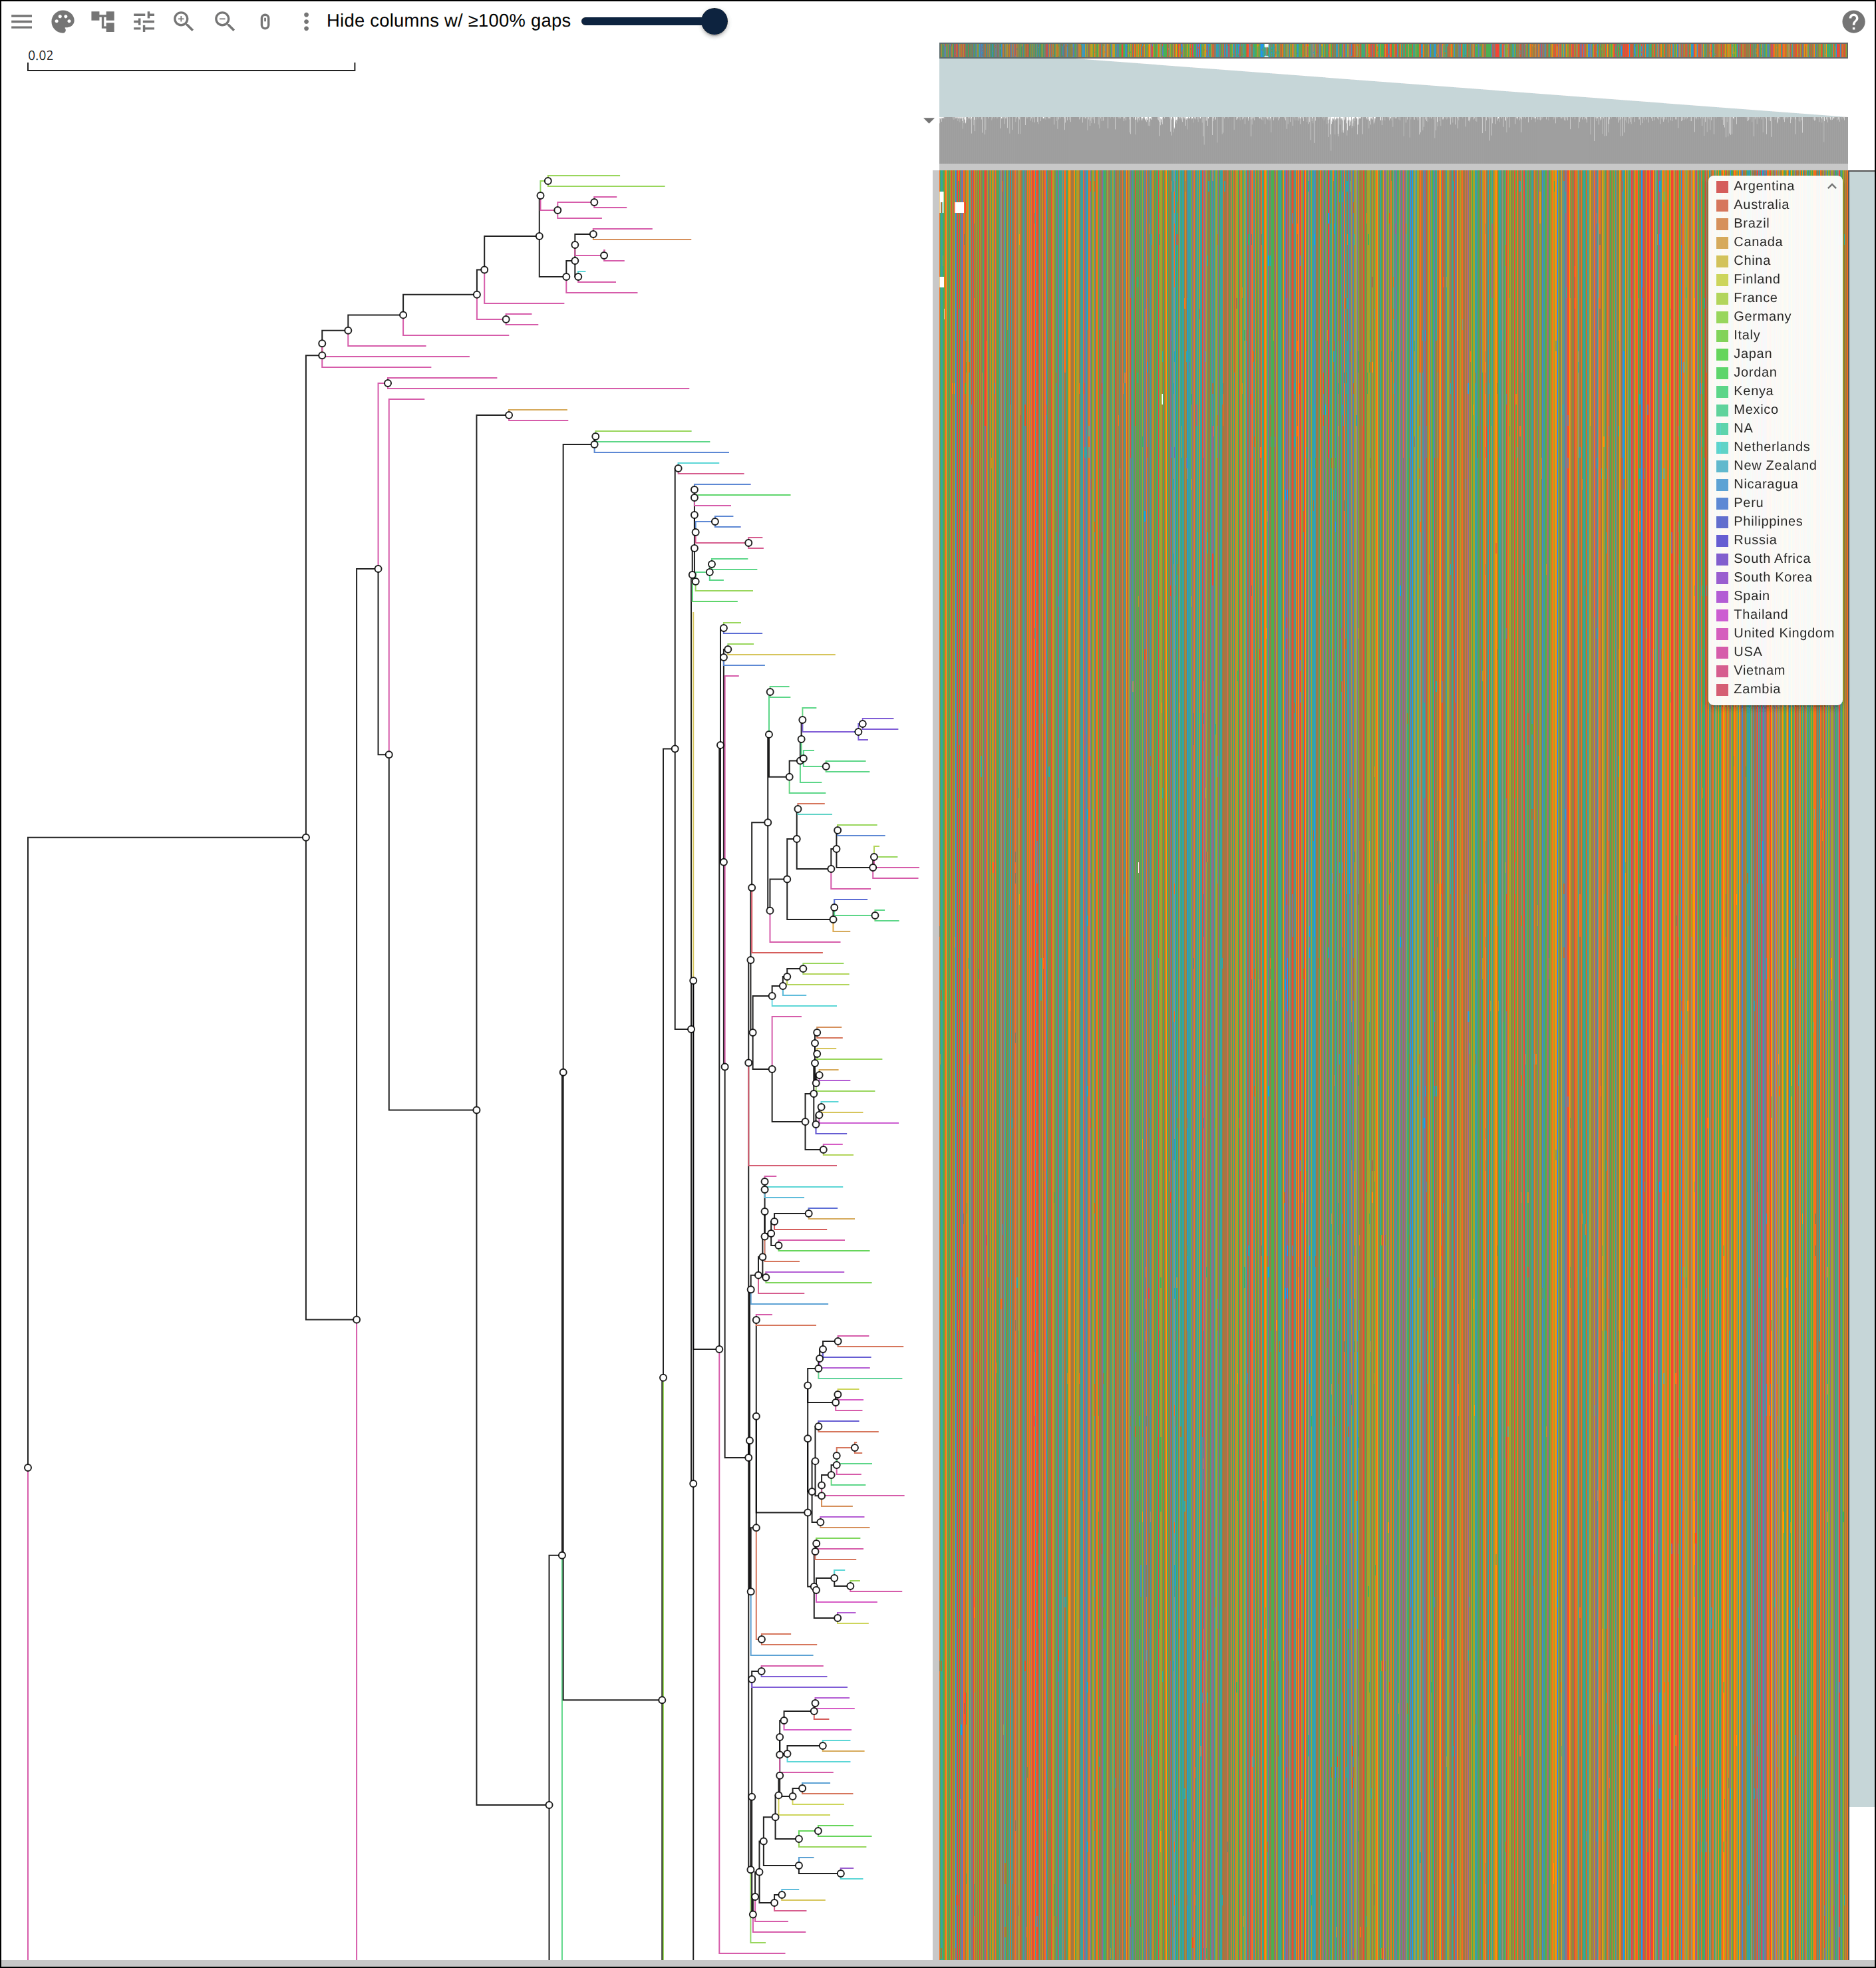
The same channel over the country field asks whether the 28 countries fall on
the tree the way the 23 clades do:
"encodings": [{ "channel": "branch", "field": "country" }]branch by clade: 293/363 edges colored, 109/179 of them above an internal node
branch by country: 207/363 edges colored, 23/179 of them above an internal nodeTwenty-three of the 179 internal edges carry a country color, against 109 for clade.
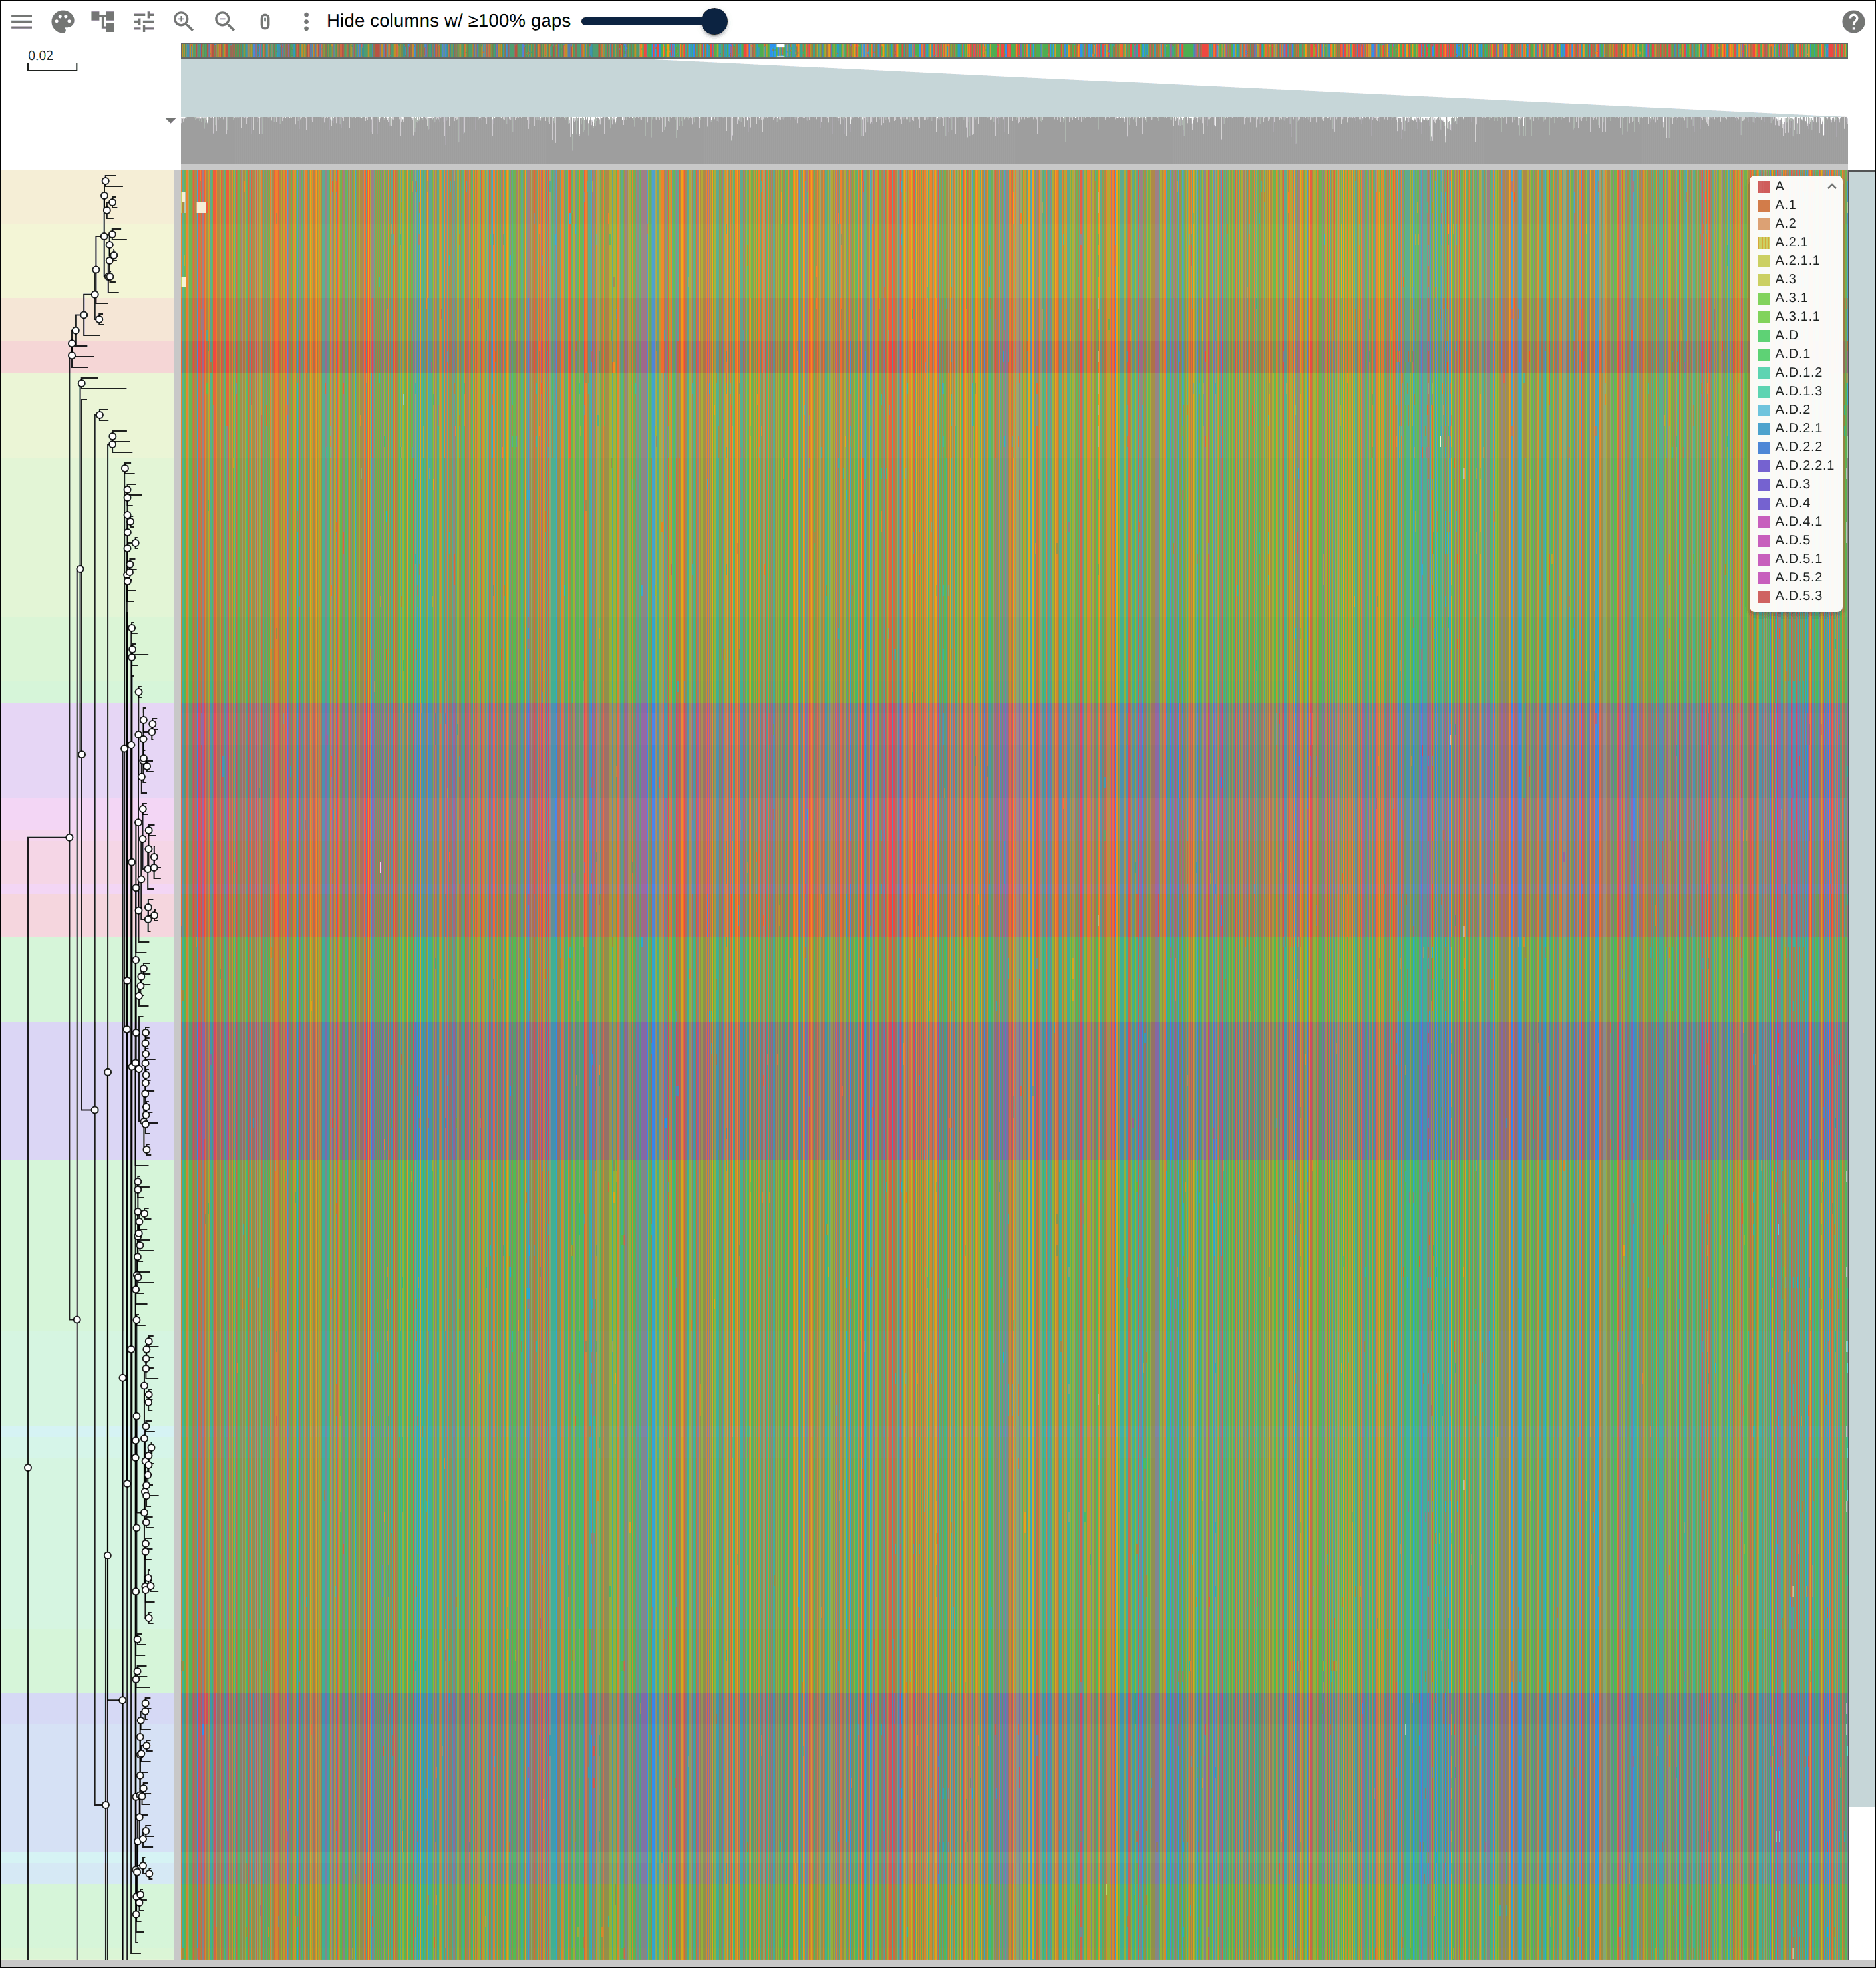
5. Rows tinted by clade#
The rowTint channel washes a color across the whole row, the tree gutter and
the alignment together:
"encodings": [{ "channel": "rowTint", "field": "clade" }]Step 5 of the
phylogeny-at-scale page
drew bands over the same 184 rows by listing the row names of its six largest
clades in six highlights records: 122 names, 6,586 characters of the link. One
rowTint record draws a band for each of the 23 clades in the table.
6. A rectangle over one clade#
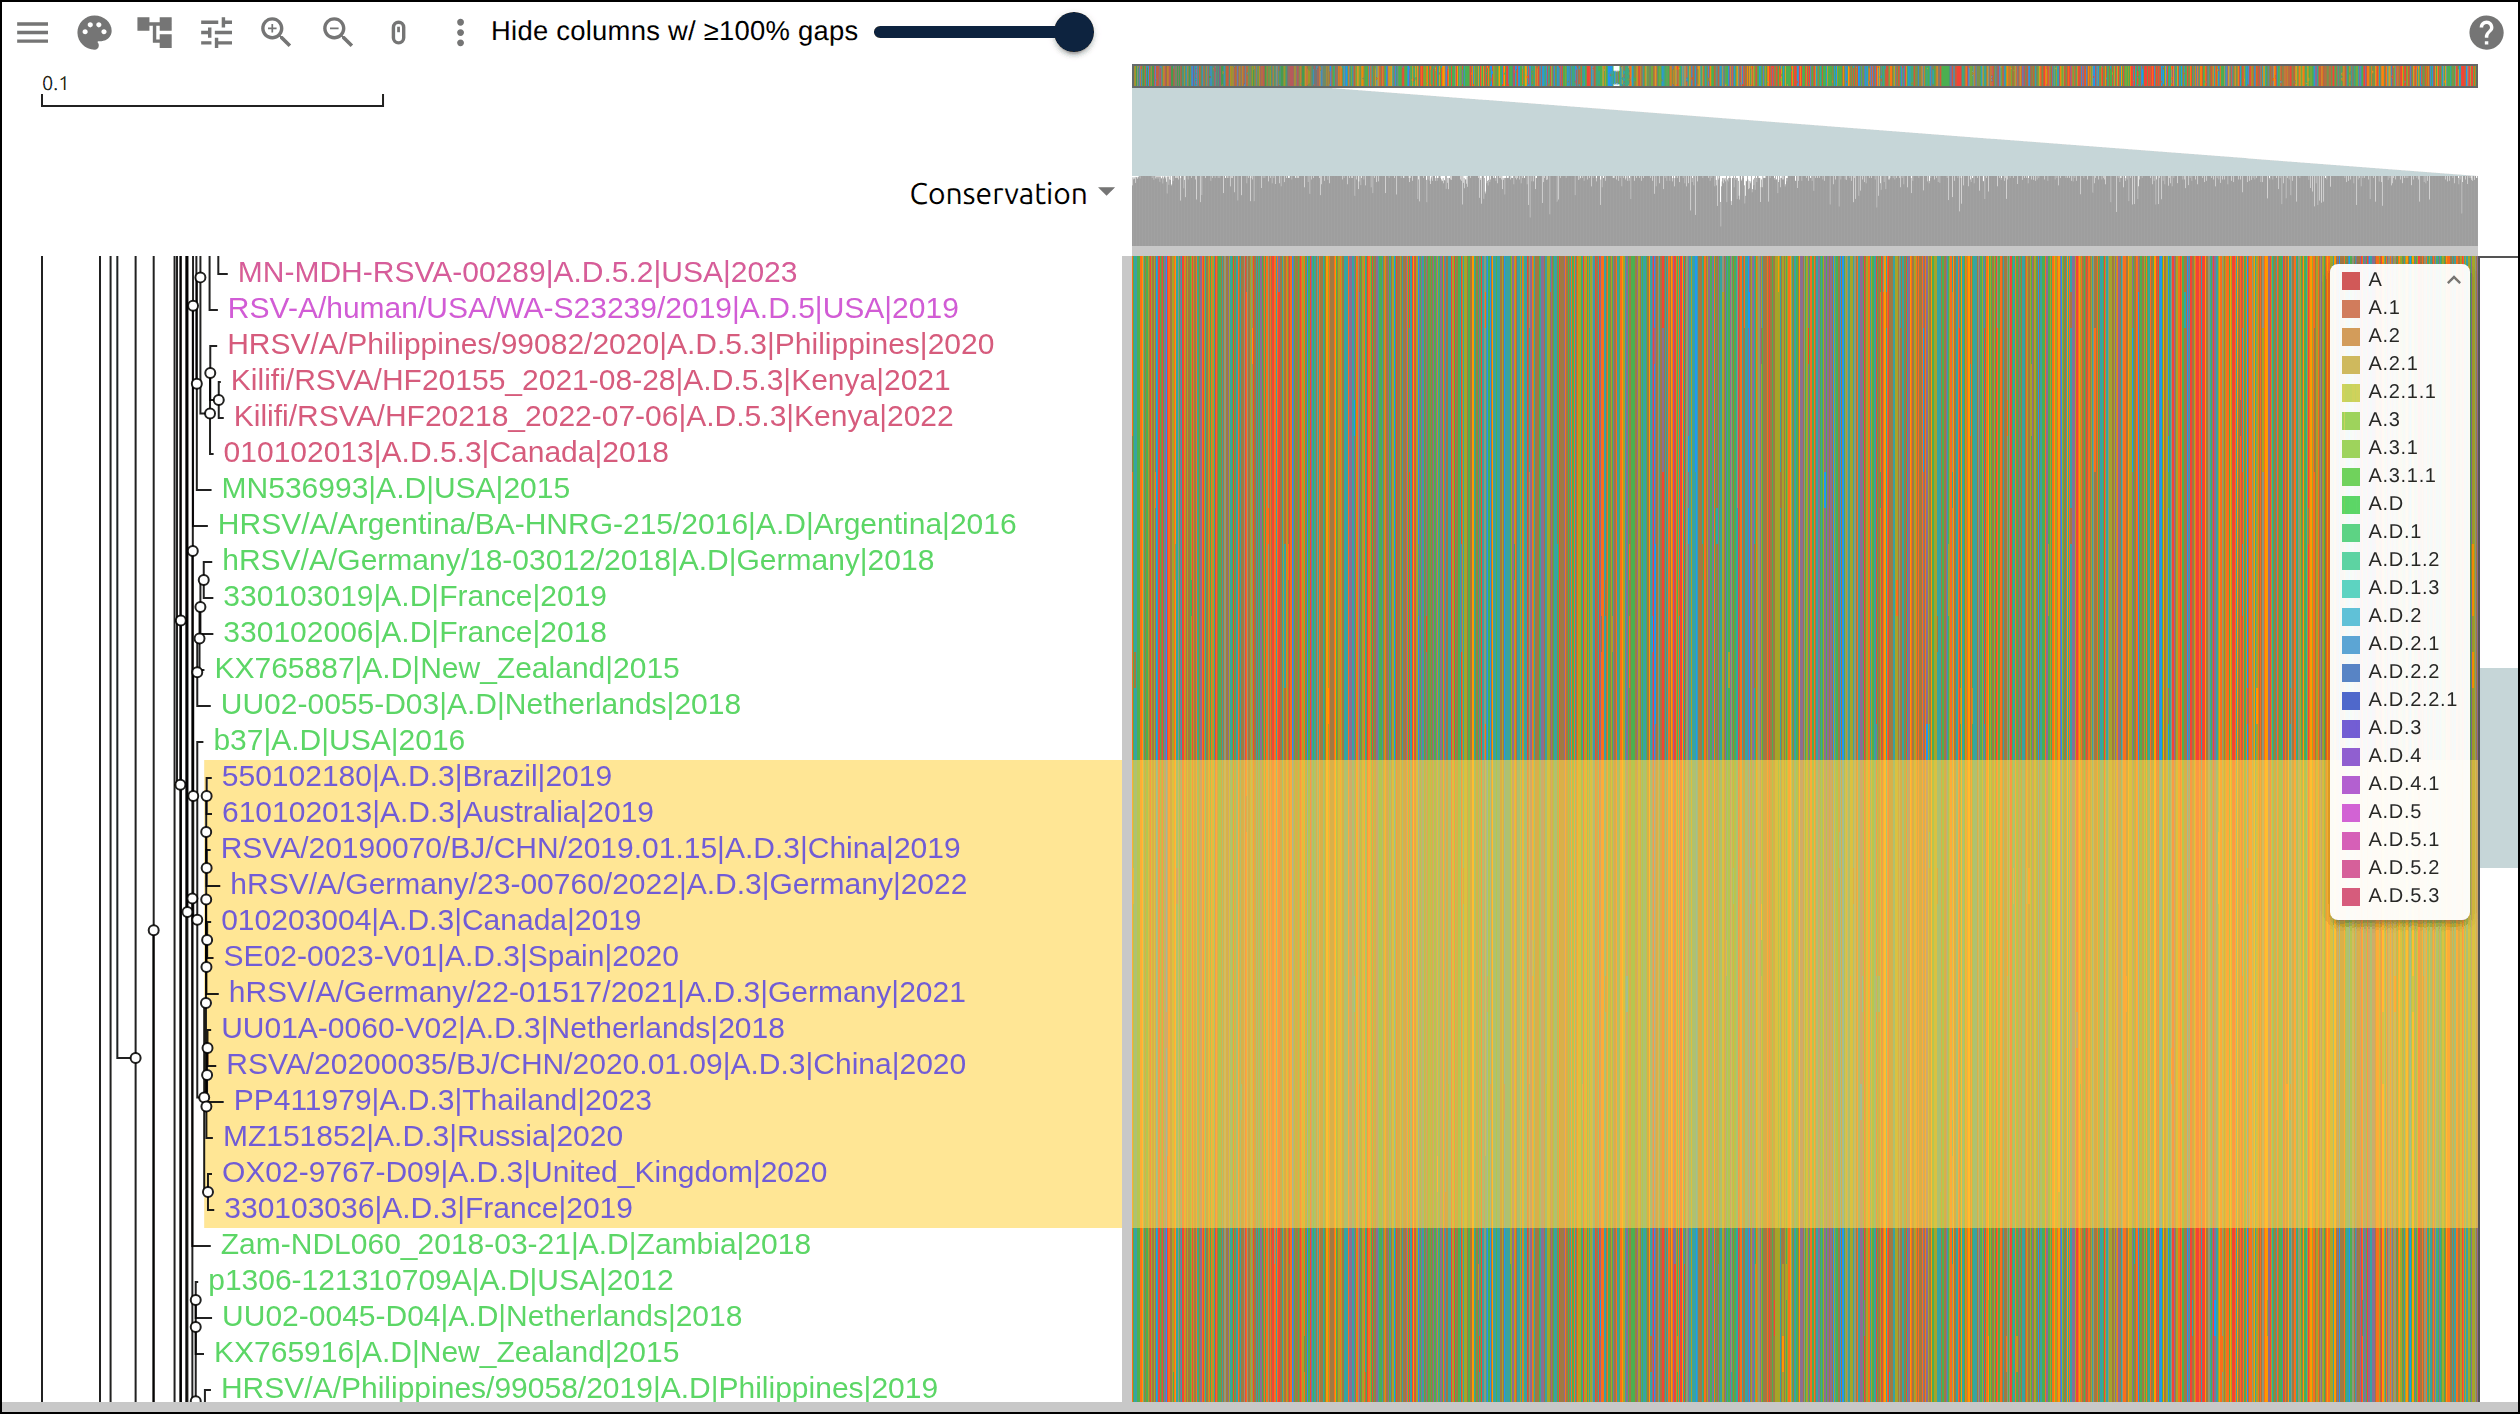
A clades record marks a clade of the tree. mrca names two tips whose common
ancestor is the clade, and tips is the leaf count the producer measured under
that ancestor:
"clades": [
  {
    "mrca": ["330103036|A.D.3|France|2019", "MZ151852|A.D.3|Russia|2020"],
    "tips": 13,
    "mark": "highlight",
    "color": "#ffd54f"
  }
]
The script picks both names and the count. It walks the pruned tree for the clade calls whose tips are exactly the tips under one node, and takes the largest:
13 of the 23 clades are one node's tips
largest of them: A.D.3, 13 tips
  mrca tips: 330103036|A.D.3|France|2019 and MZ151852|A.D.3|Russia|2020
A.D.3 spans display rows 80-92
The two names sit under different children of that node, so their common ancestor is the node itself whatever the tree does below them. The viewer resolves the ancestor, counts the leaves under it and compares the count with the 13 in the record. Writing 12 there drops the rectangle, so a re-rooted or re-estimated tree loses the mark while the count guards which clade it covers.
tipLabel channel gives
that value.7. The link, and one row checked against the JSON#
Every layer above is a property of the view, so the whole figure travels in one
link. The last one carries the three filehandles, two encodings and the clade
record, and moves the tint to the region field, which adds a second legend:
"encodings": [
  { "channel": "tipLabel", "field": "clade" },
  { "channel": "rowTint", "field": "region" }
]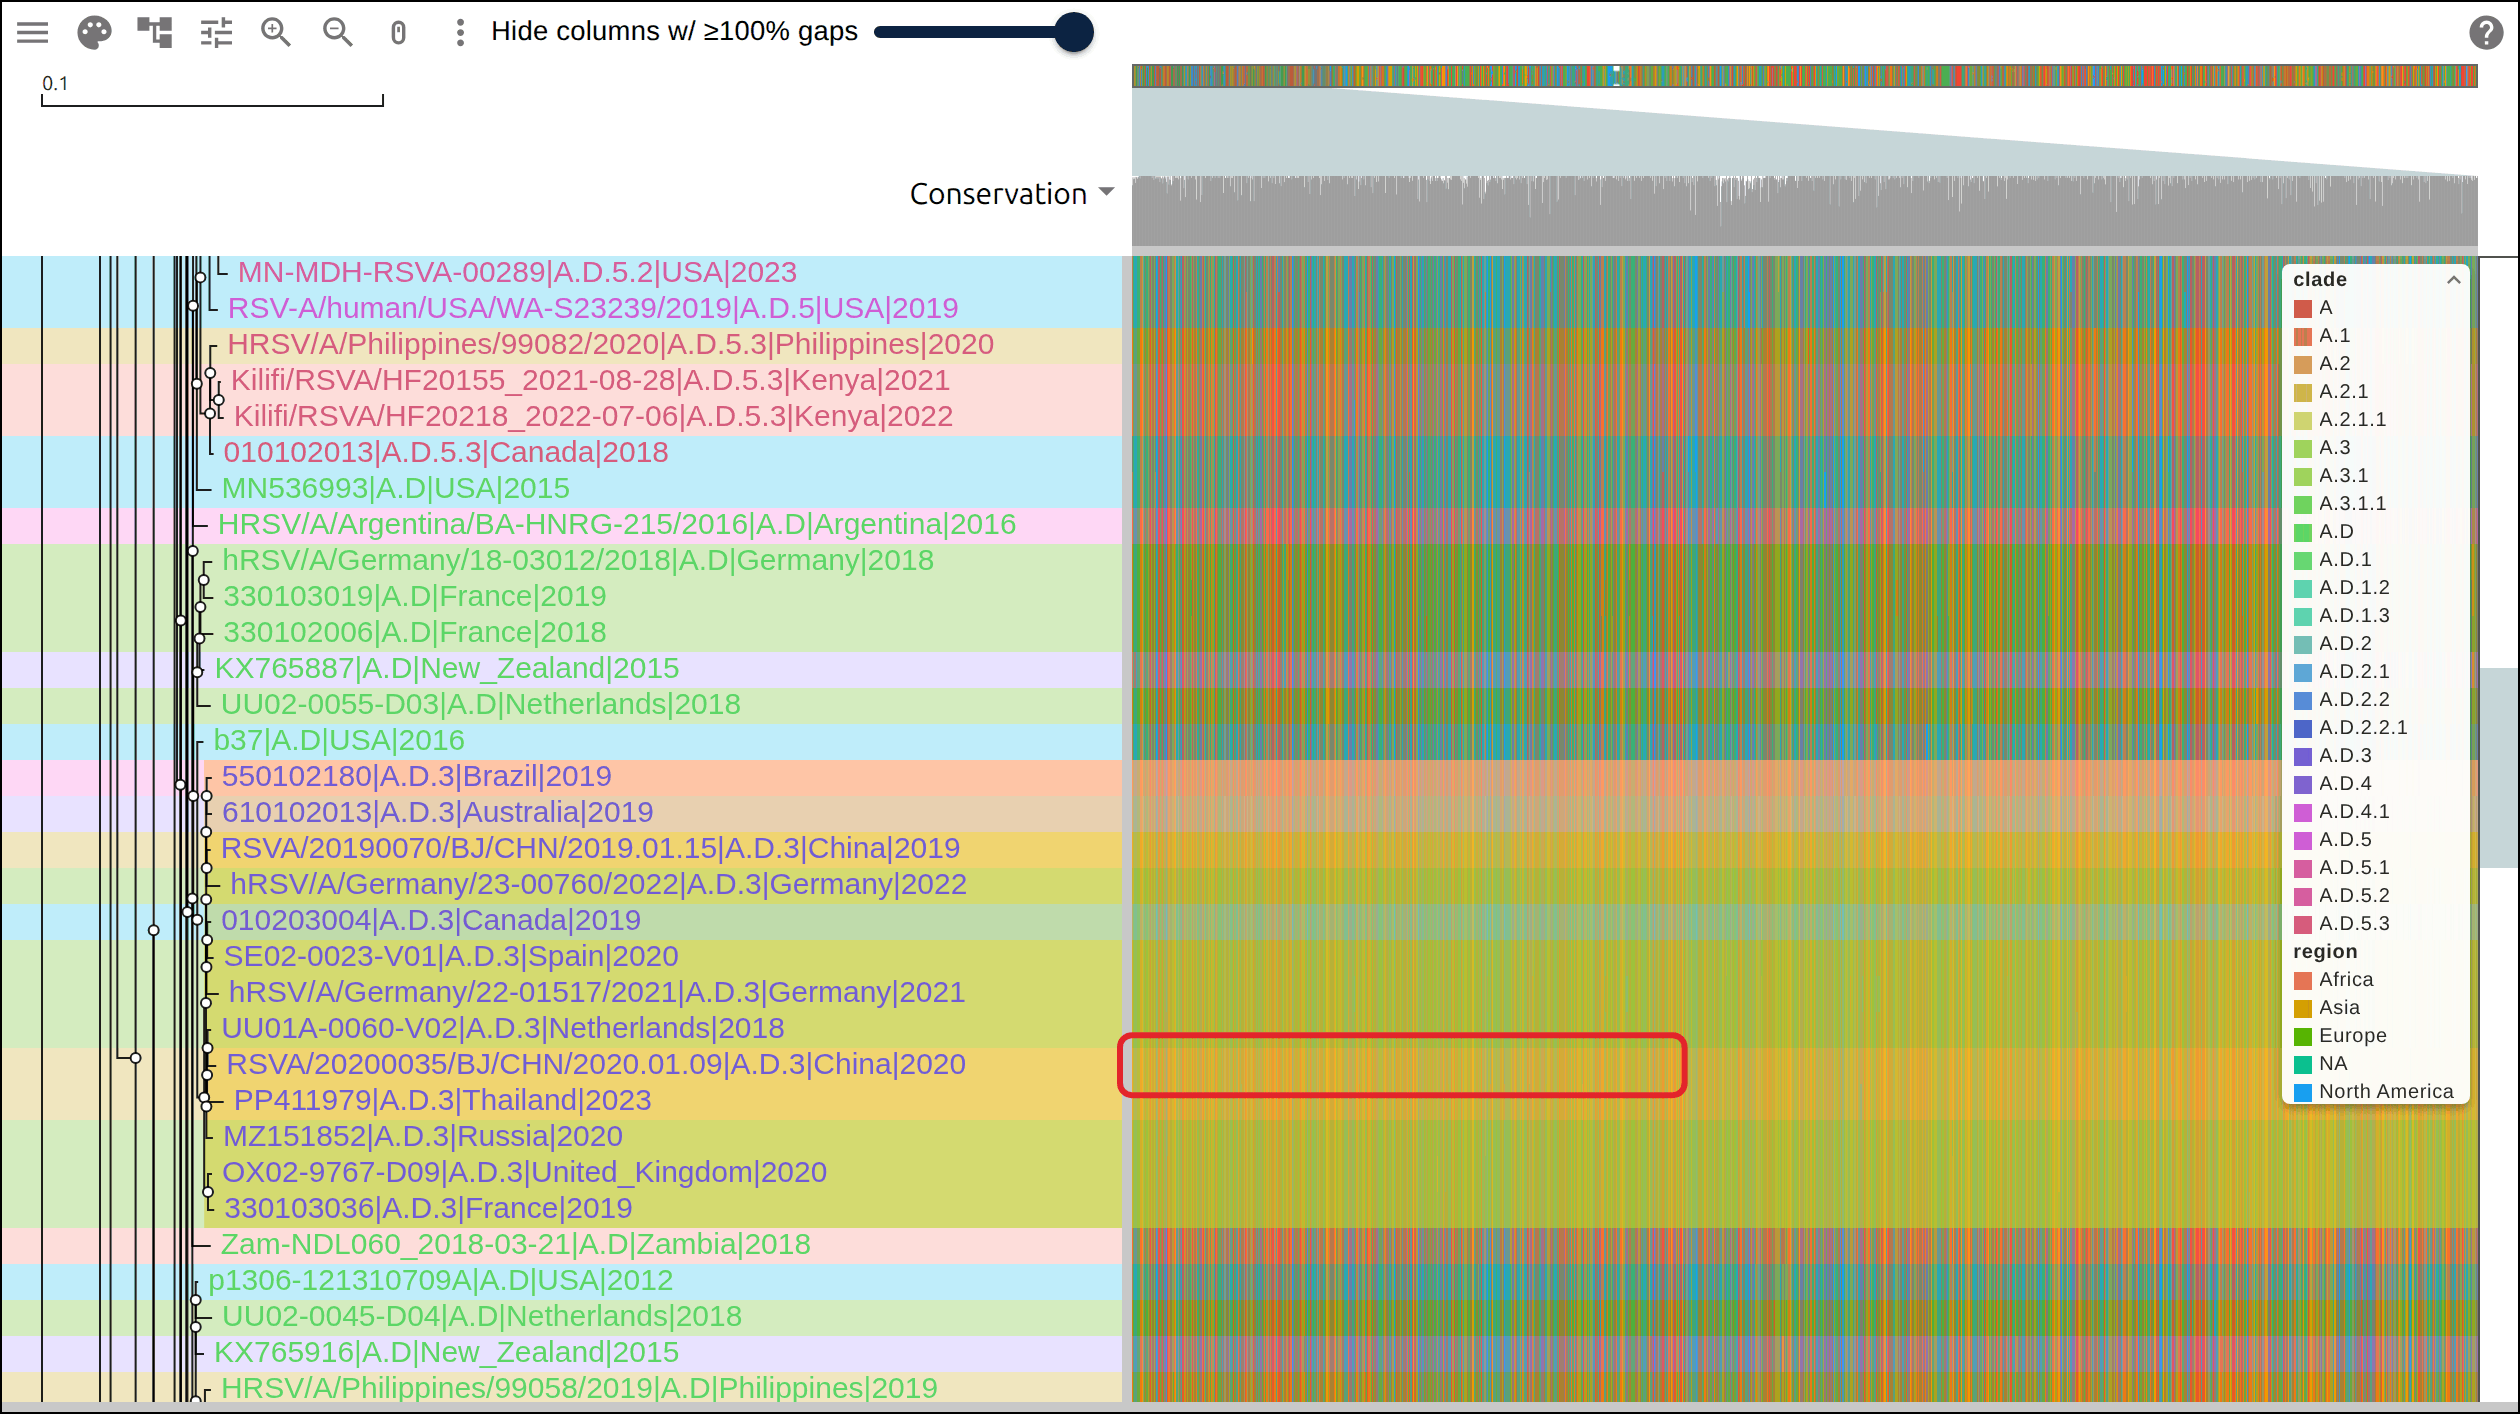
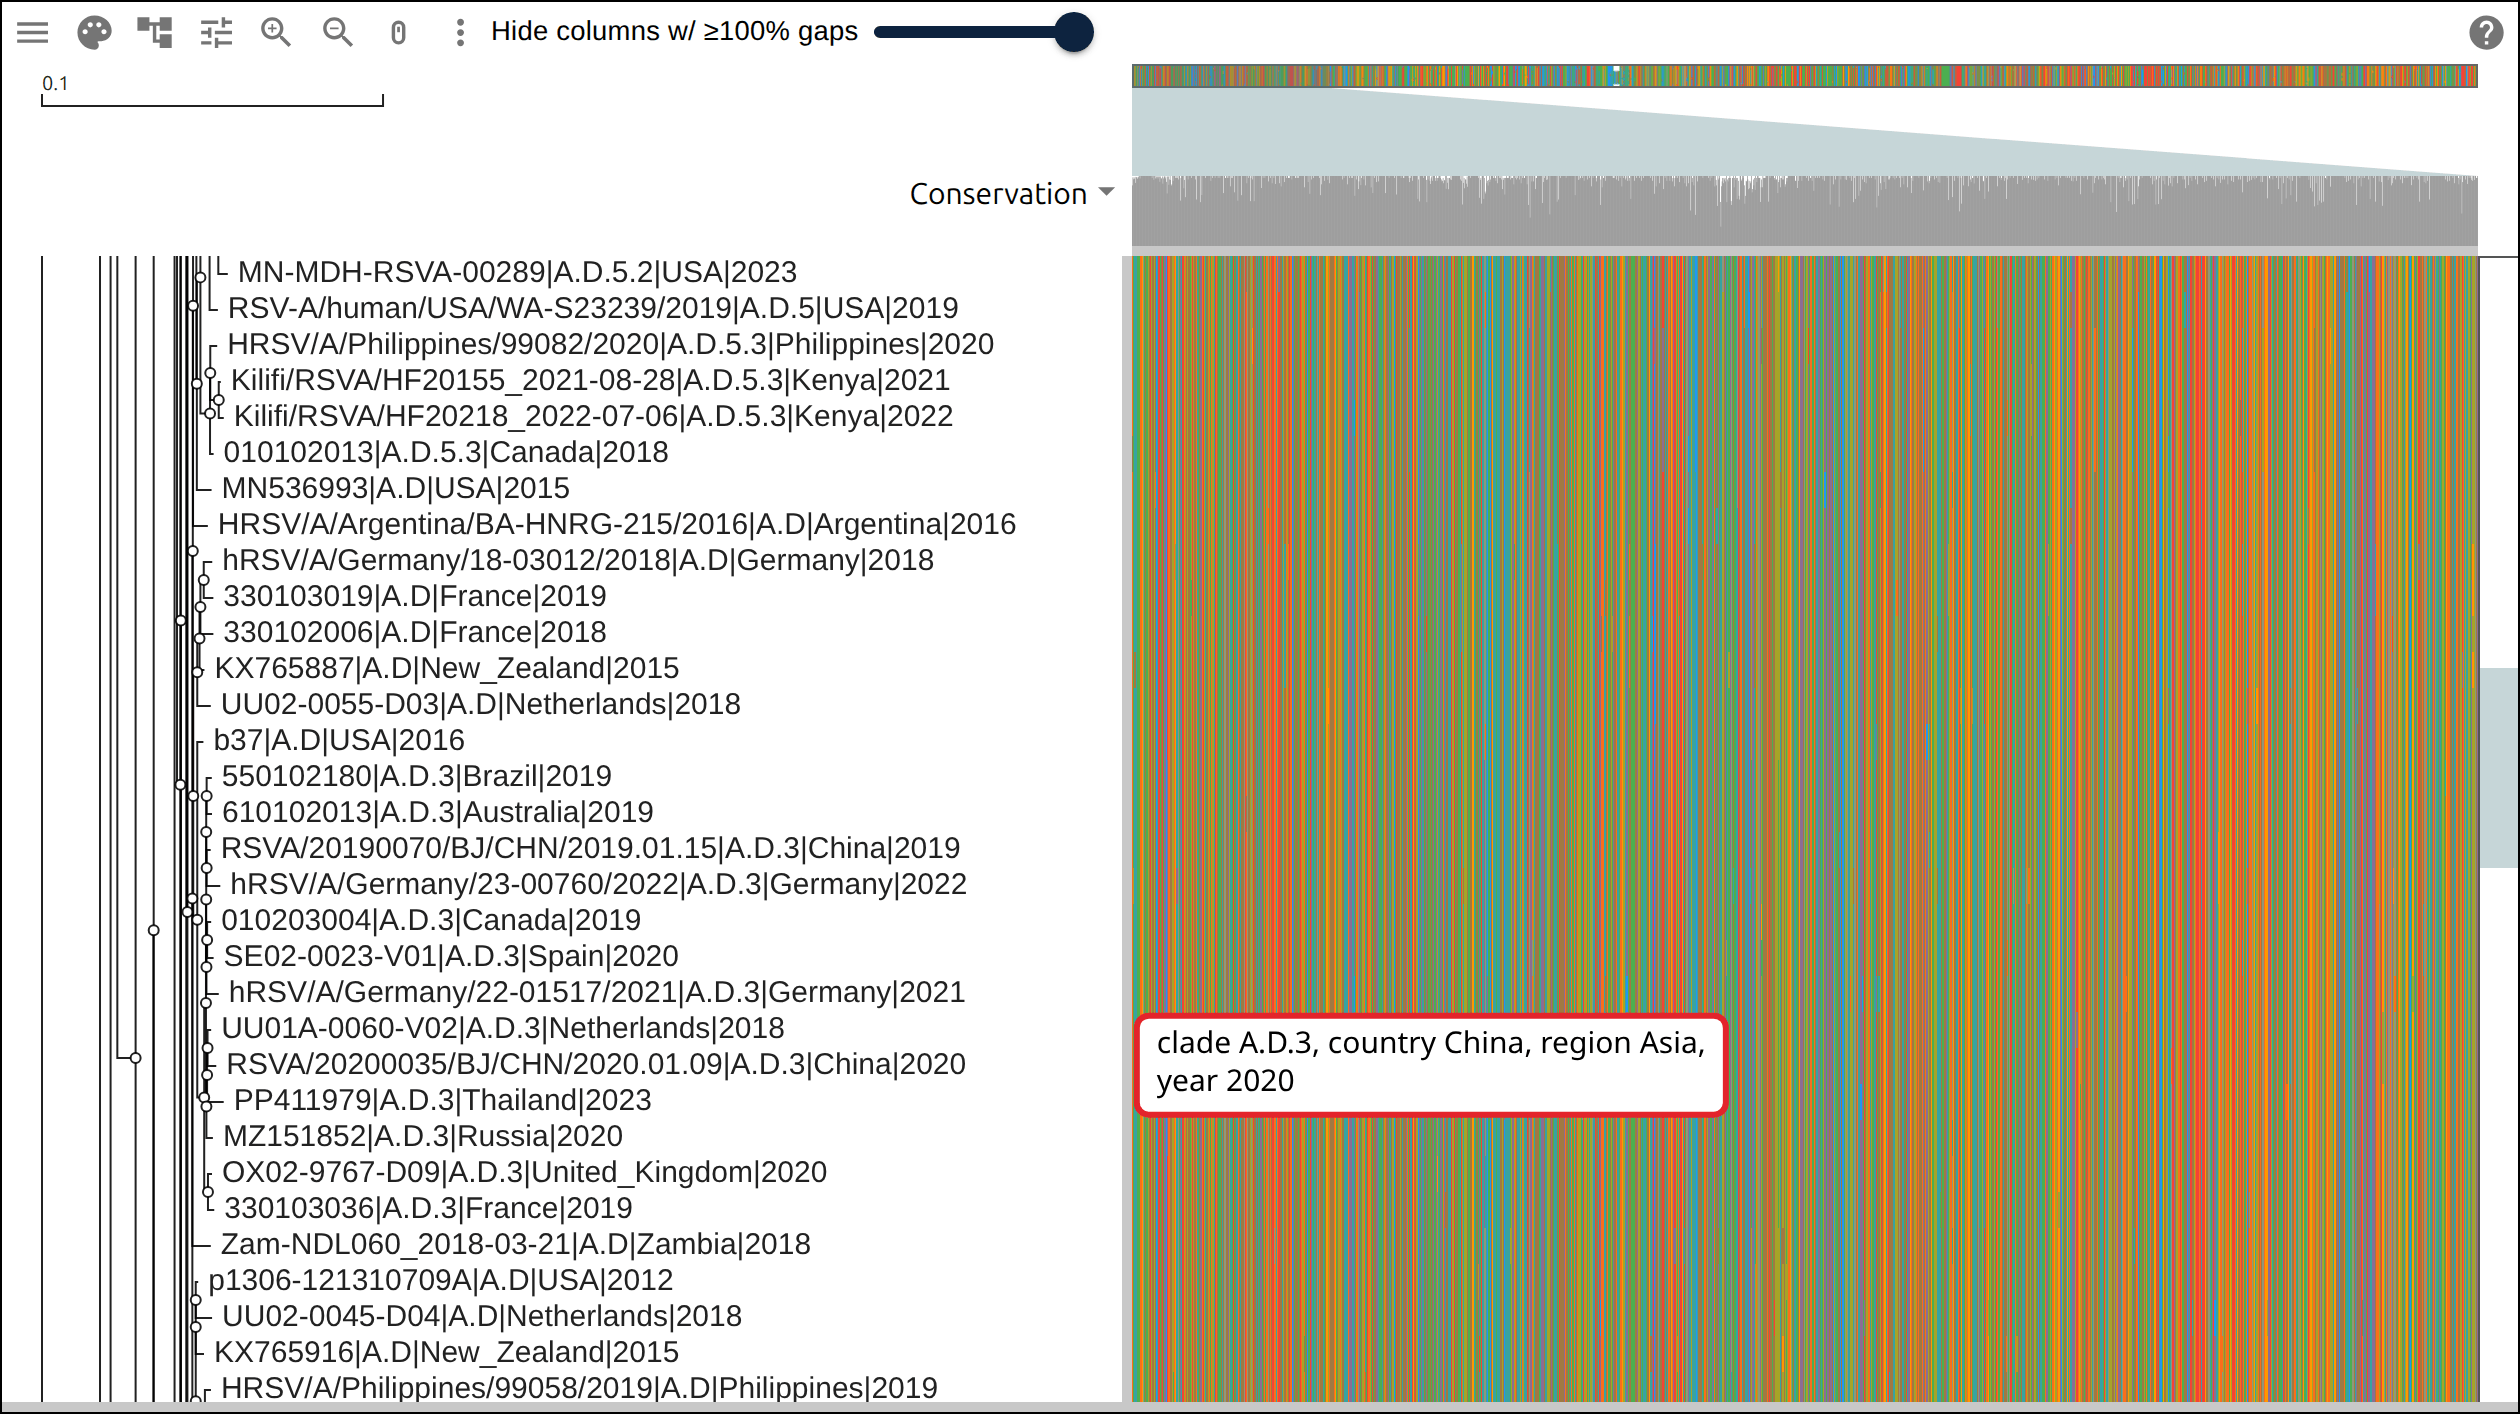
The row in the box is the tip the build script prints last, with its entry in the auspice JSON beside the record the table gives it:
check tip: RSVA/20200035/BJ/CHN/2020.01.09|A.D.3|China|2020, display row 88
  node_attrs: {"clade_membership": {"value": "A.D.3"}, "country": {"value": "China", "confidence": {"China": 1.0}, "entropy": -1.000088900581841e-12}, "region": {"value": "Asia"}, "num_date": {"value": 2020.0232240437158}}
  row: {"clade": "A.D.3", "country": "China", "region": "Asia", "year": "2020"}
On screen that row has a purple label, the A.D.3 color in the clade legend; it sits inside the amber rectangle, whose 13 tips are the A.D.3 clade; and its tint is the Asia color in the region legend. The date rounds down to the year 2020, which is the last field of the row name the tree already carried.
Reproduce it end to end#
curl -O https://raw.githubusercontent.com/GMOD/JBrowseMSA/main/docs/tutorials/scripts/build_phylogeny_metadata.py
python3 build_phylogeny_metadata.py .
The argument is the directory to work in. The script fetches the Nextstrain
build there, writes rsv-sample-rowdata.json beside it, and prints every number
on this page. The alignment and the tree come from
build_phylogeny_at_scale.sh,
which takes the same subsample of the same build.
See also#
References#
- Hadfield J, Megill C, Bell SM, et al. Nextstrain: real-time tracking of pathogen evolution. Bioinformatics 34:4121-4123.
- Yu G, Smith DK, Zhu H, Guan Y, Lam TT. ggtree: an R package for visualization and annotation of phylogenetic trees with their covariates and other associated data. Methods Ecol Evol 8:28-36.
- Goya S, Galiano M, Nauwelaers I, et al. Toward unified molecular surveillance of RSV: a proposal for genotype definition and nomenclature harmonized with WHO clinical severity groups. Influenza Other Respir Viruses 14:274-285.