Comparing genomes: linear synteny and dotplots
Source:vignettes/comparative-synteny.Rmd
comparative-synteny.RmdJBrowseR() renders a single linear genome view. For
comparative genomics — several genomes stacked, the blocks each pair
shares drawn between the rows — JBrowseRApp() drives the
full app from a declarative views list. Each entry is
list(type = , ...) with the view’s settings written beside
type — the same object a config.json’s
defaultSession.views holds, and the same one JBrowse Web
reads from its ?session=spec-…
URLs. The settings are the view’s own state-model
options. There are no R builders for it, so any view type JBrowse
has — including one a runtime plugin registers — opens with nothing
added to the package.
This vignette stacks four E. coli strains (K12, Sakai, CFT073, NCTC86) tied together by one all-vs-all minimap2 alignment — the same hosted data as the JBrowse all-vs-all synteny tutorial.
The website hosts the same views
as live widgets, and everything here also runs on Colab’s R runtime:

Describe the four assemblies
An assembly is the flat list(name = , uri = ) shorthand
JBrowse expands itself — it picks the adapter from the extension and
derives the .fai/.gzi index locations, so the
URL is all you write. (a list(name=, uri=) is the same
thing with the name defaulted from the file.)
One all-vs-all track between them
A single MultiGenomePAFAdapter track serves every pair
from one PAF file. It spans all four assemblies. The track config is a
plain list, the same JSON a JBrowse config file would hold.
Stack them in a synteny view
The view’s own views lists the panels top-to-bottom, one
list(assembly = ) each. The four rows have three gaps
between adjacent pairs, and each gap draws the same all-vs-all track, so
tracks is that trackId once per gap.
drawCurves = FALSE draws straight ribbons;
minAlignmentLength hides short, noisy blocks.
app <- JBrowseRApp(
  assemblies = assemblies,
  tracks = list(ecoli_ava),
  views = list(
    list(
      type = "LinearSyntenyView",
      views = lapply(strains, \(s) list(assembly = s)),
      tracks = list(list("ecoli_ava"), list("ecoli_ava"), list("ecoli_ava")),
      drawCurves = FALSE,
      minAlignmentLength = 10000
    )
  )
)
app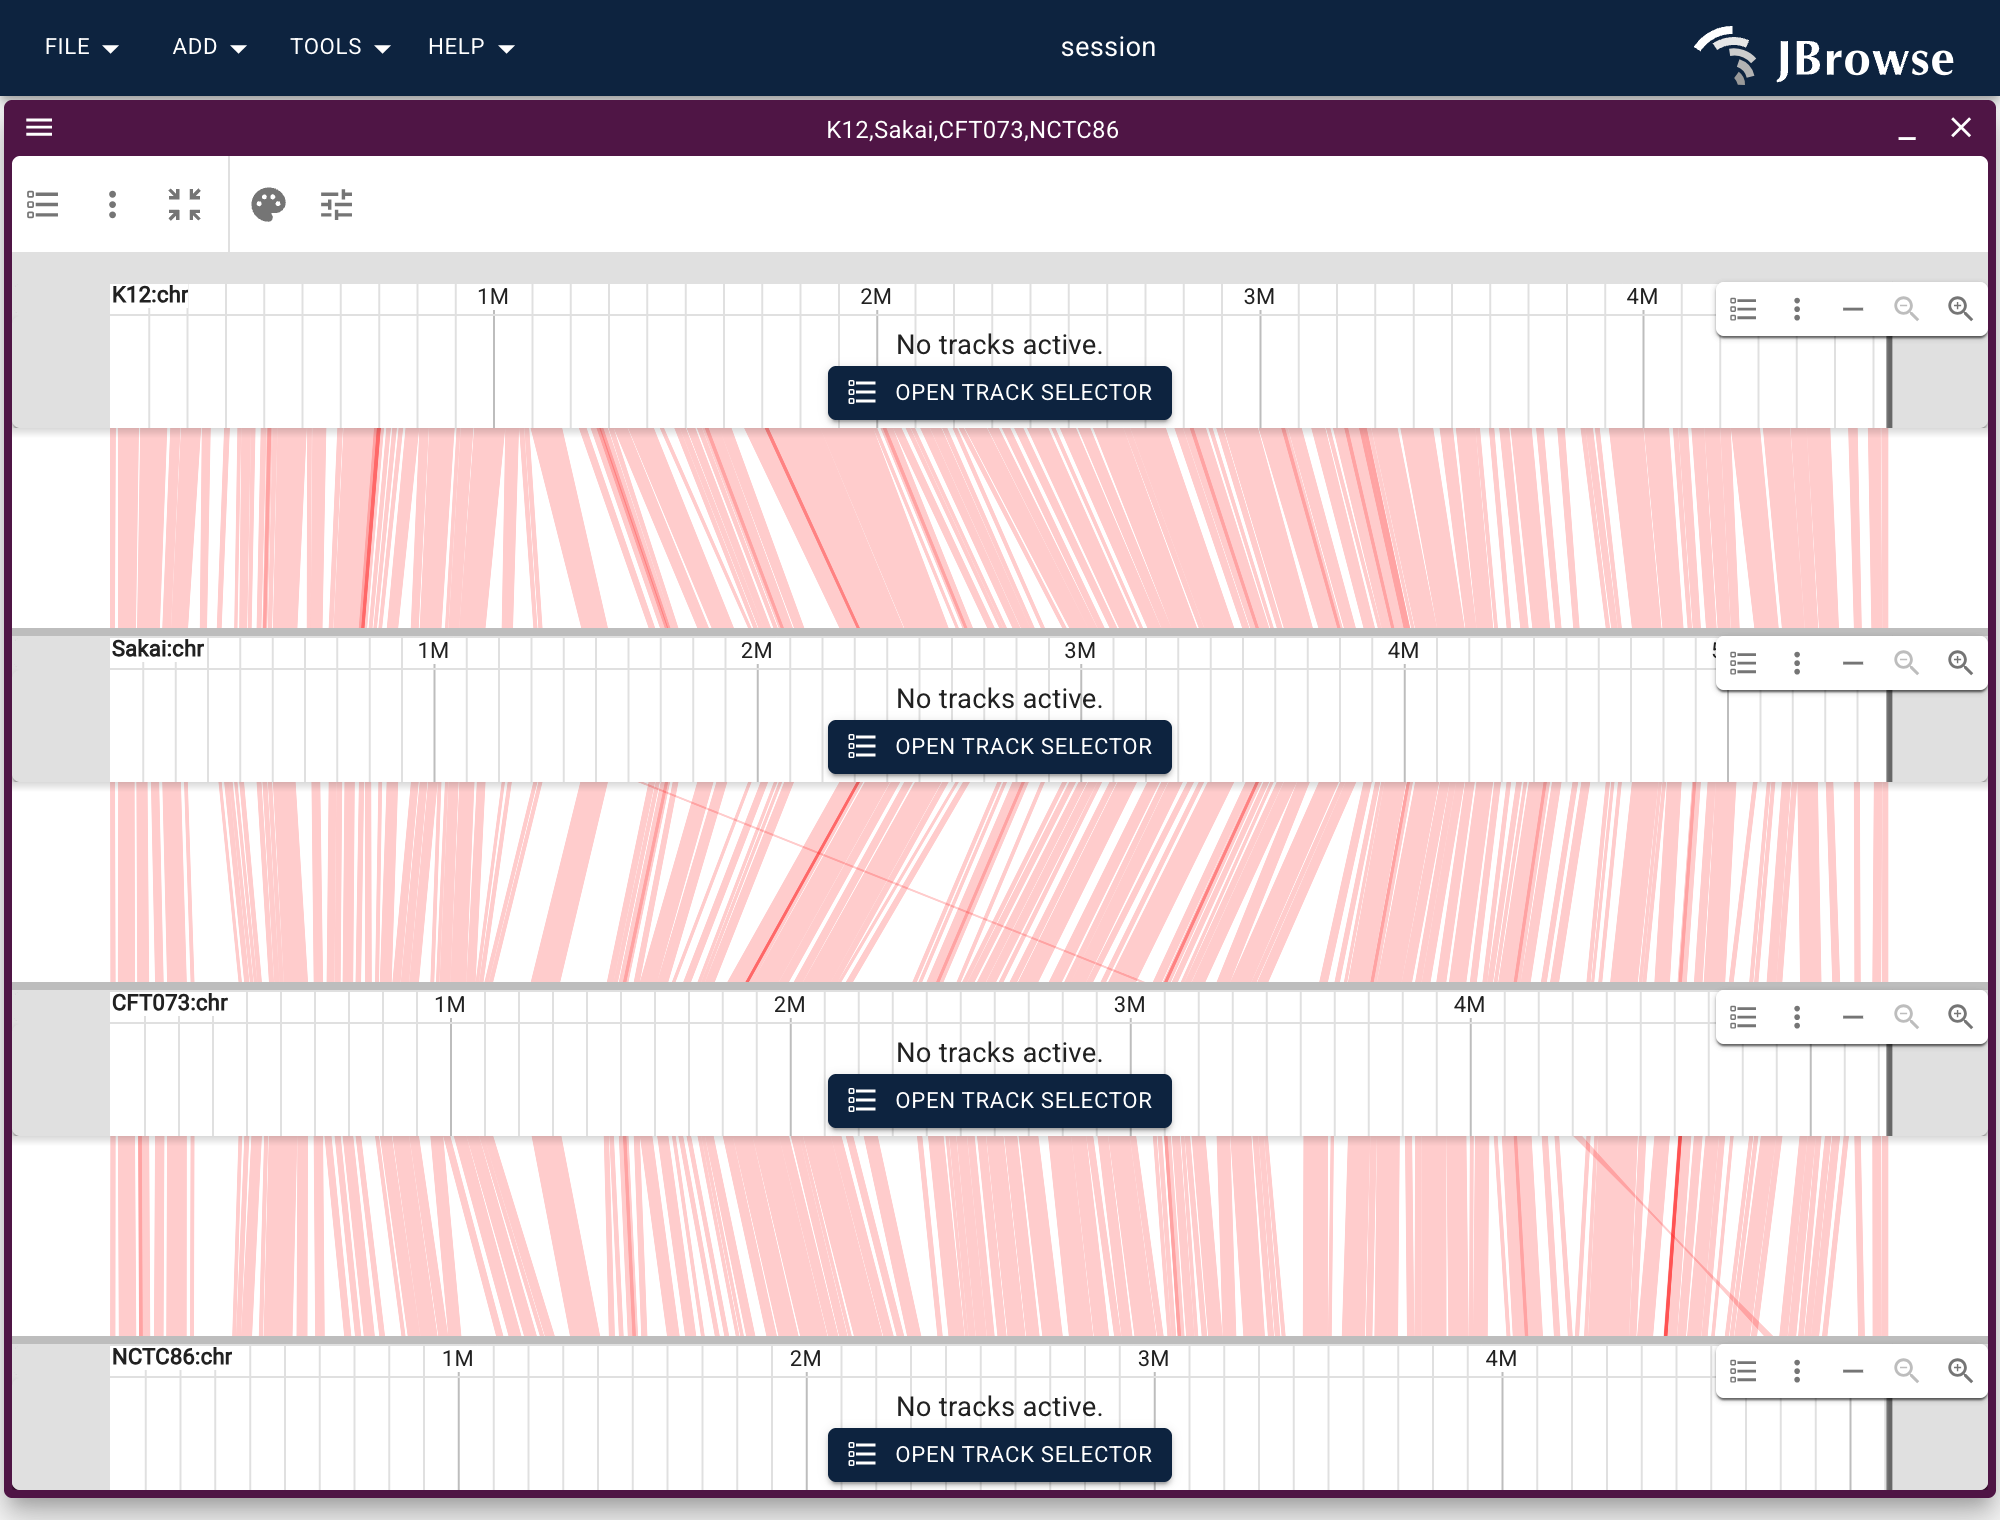
In the console this opens a browser tab; in R Markdown it renders
inline; in Shiny, pair JBrowseRAppOutput() with
renderJBrowseRApp().
The same PAF as a dotplot
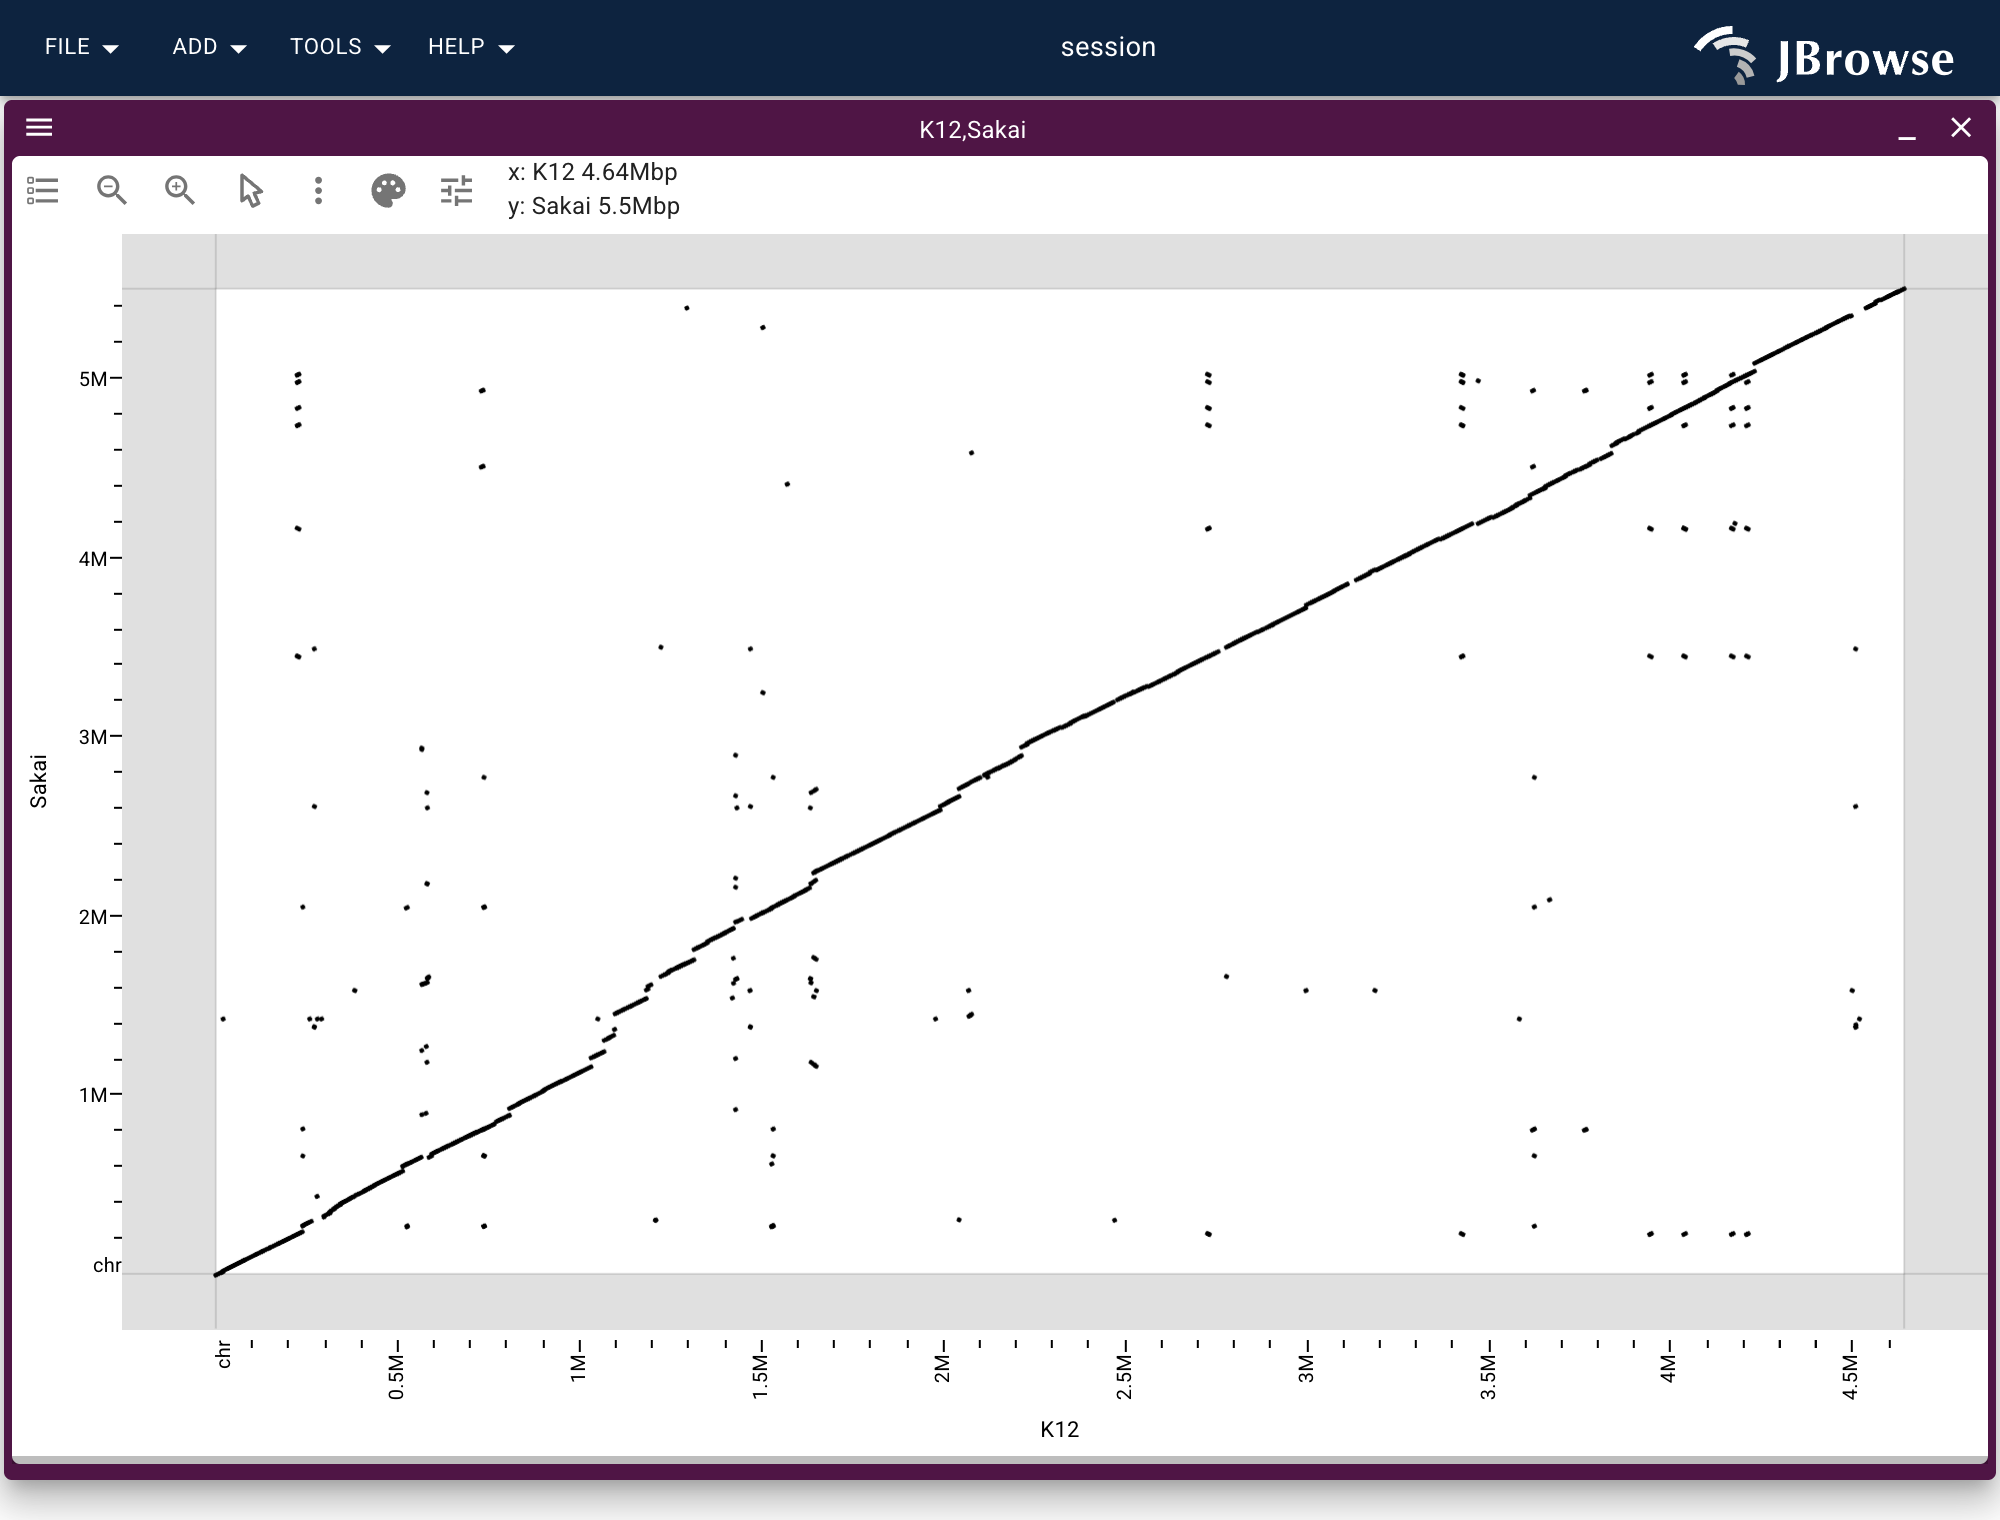
Any one pair opens whole-genome as a dotplot — the long diagonal is the shared backbone, off-diagonal segments are rearrangements.
JBrowseRApp(
  assemblies = assemblies[1:2],
  tracks = list(ecoli_ava),
  views = list(list(
    type = "DotplotView",
    views = list(list(assembly = "K12"), list(assembly = "Sakai")),
    tracks = list("ecoli_ava")
  ))
)
Building the PAF from your own genomes
The hosted all_vs_all.paf.gz comes from concatenating
the strains (each contig PanSN-named sample#1#contig) and
running minimap2 -c -x asm20 --eqx all pairs. The tutorial
walks through generating it and loading per-strain gene tracks
alongside.