
JBrowseR provides an R interface to the JBrowse 2 genome browser. It renders the interactive, GPU-accelerated JBrowse 2 linear genome view as an htmlwidget, so you can embed a full genome browser in an R Markdown document, a Shiny app, or straight from the R console.
The API is JBrowse’s own: JBrowseR() takes the options of JBrowse’s createLinearGenomeView, and JBrowseRApp() those of createApp, as named arguments under JBrowse’s names. Assemblies, tracks and sessions are the same JSON objects a config.json holds, written as R lists, so an option, track type or view type JBrowse gains needs nothing added to the package.
library(JBrowseR)

# an entire human genome browser in one line — assembly, reference name
# aliases, cytobands, and gene-name search all included
JBrowseR(assembly = "hg38", location = "BRCA1")

# a whole options object kept in JSON
do.call(JBrowseR, jsonlite::read_json("options.json"))
Installation
Install from GitHub:
# install.packages("devtools")
devtools::install_github("GMOD/JBrowseR")
Quick tour
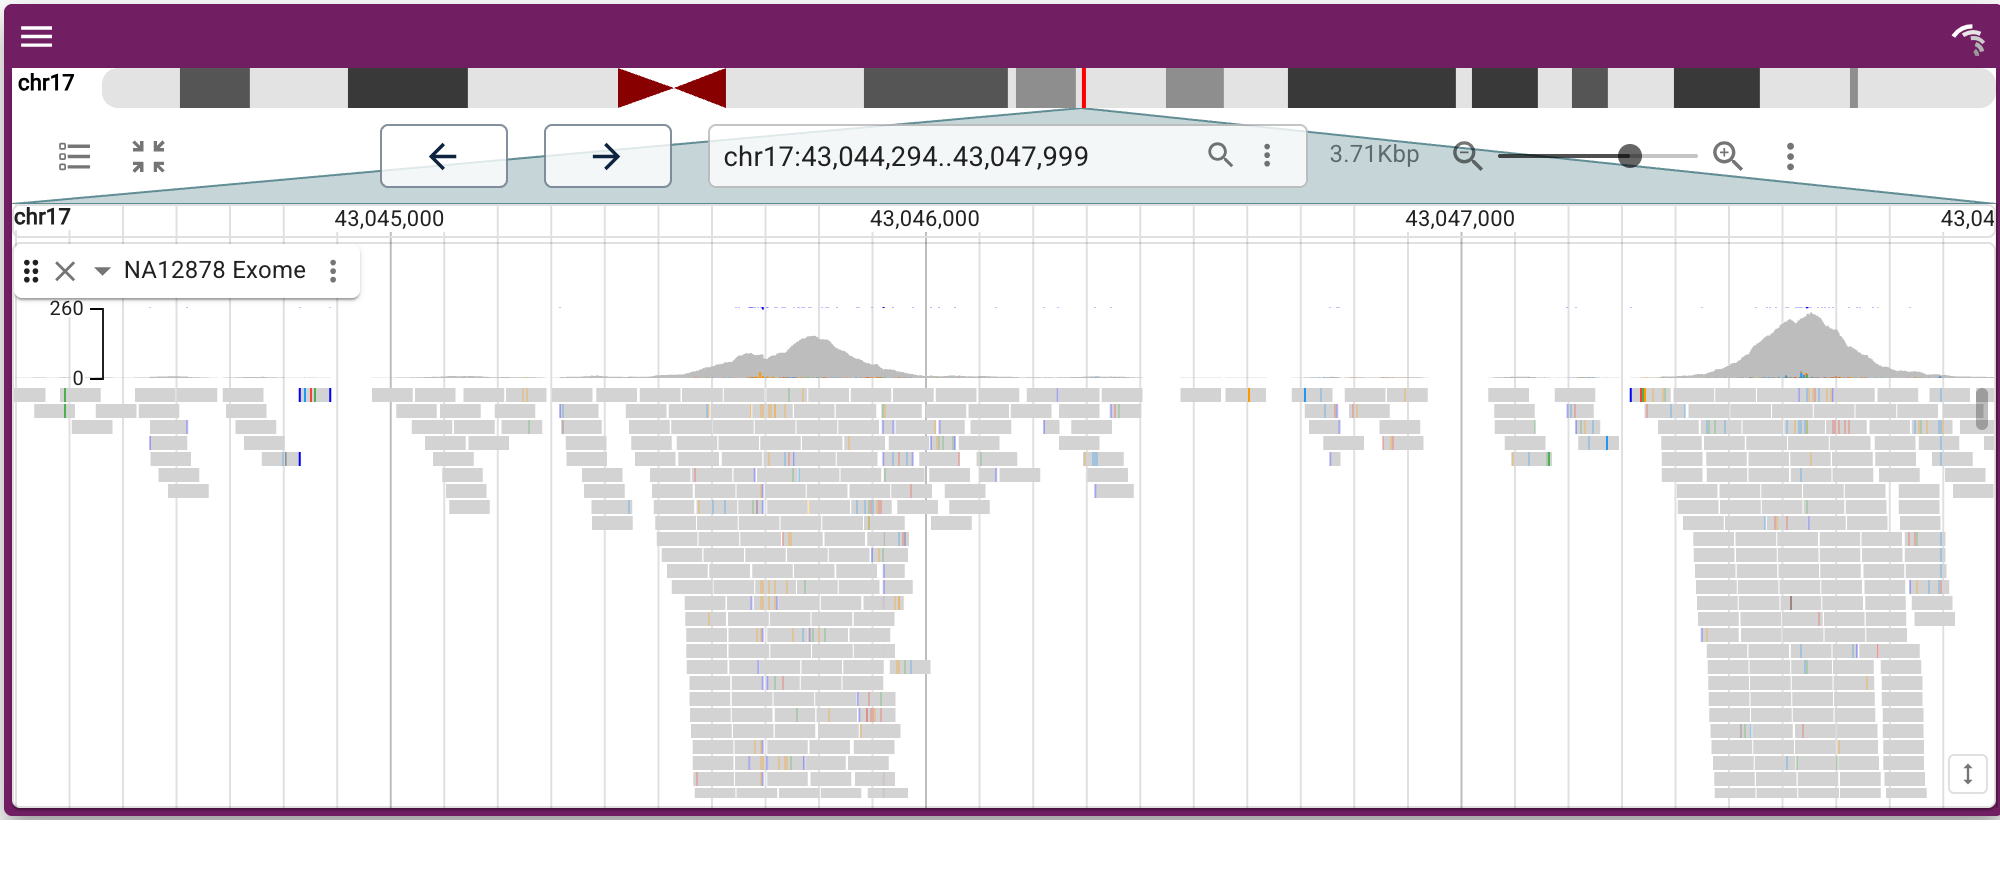
Point at a hub genome by name and add tracks by URL — the track type and its index files are inferred automatically.
JBrowseR(
  assembly = "hg38",
  tracks = list(
    list(
    uri =
      "https://jbrowse.org/genomes/GRCh38/alignments/NA12878/NA12878.alt_bwamem_GRCh38DH.20150826.CEU.exome.cram",
      name = "NA12878 Exome"
    )
  ),
  location = "17:43,044,295..43,048,000"
)
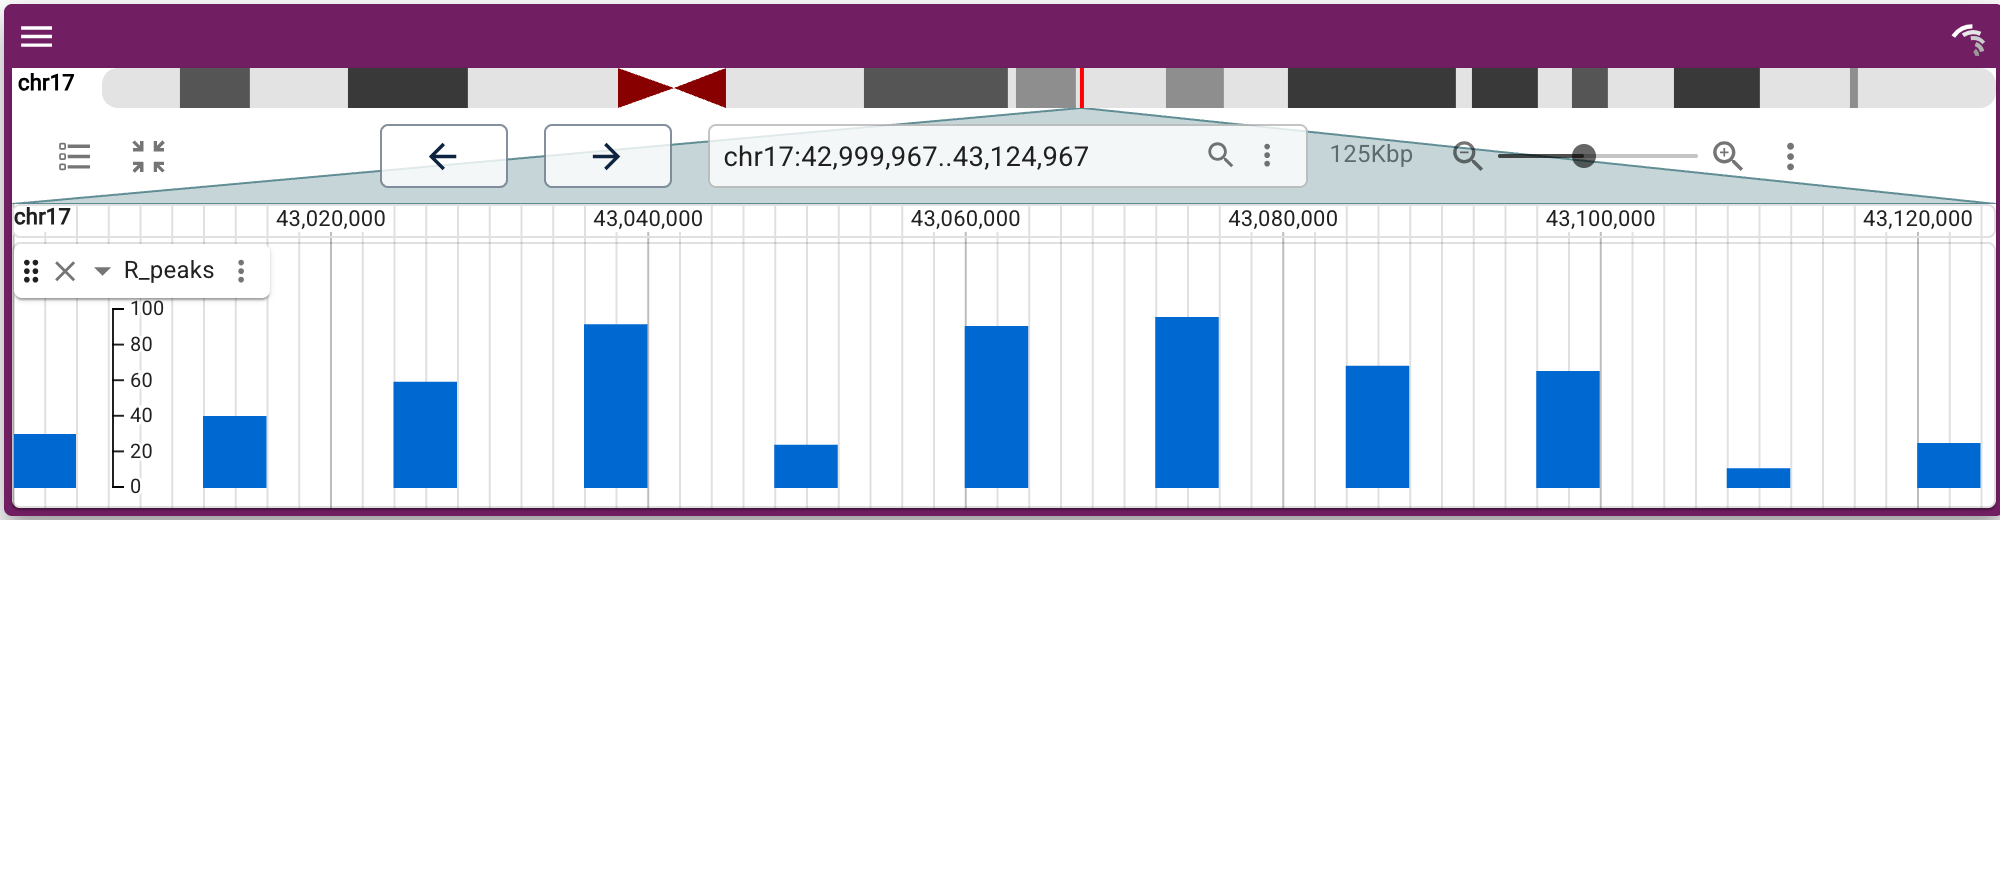
View results you computed in R directly on the genome — no files, no web server:
peaks <- data.frame(
  chrom = "17",
  start = seq(43000000, 43120000, by = 12000),
  end   = seq(43000000, 43120000, by = 12000) + 4000,
  name  = paste0("peak", 1:11),
  score = round(runif(11, 5, 100))
)

JBrowseR(
  assembly = "hg38",
  tracks = list(track_data_frame(peaks, "R_peaks")),
  location = "17:43,000,000..43,125,000"
)
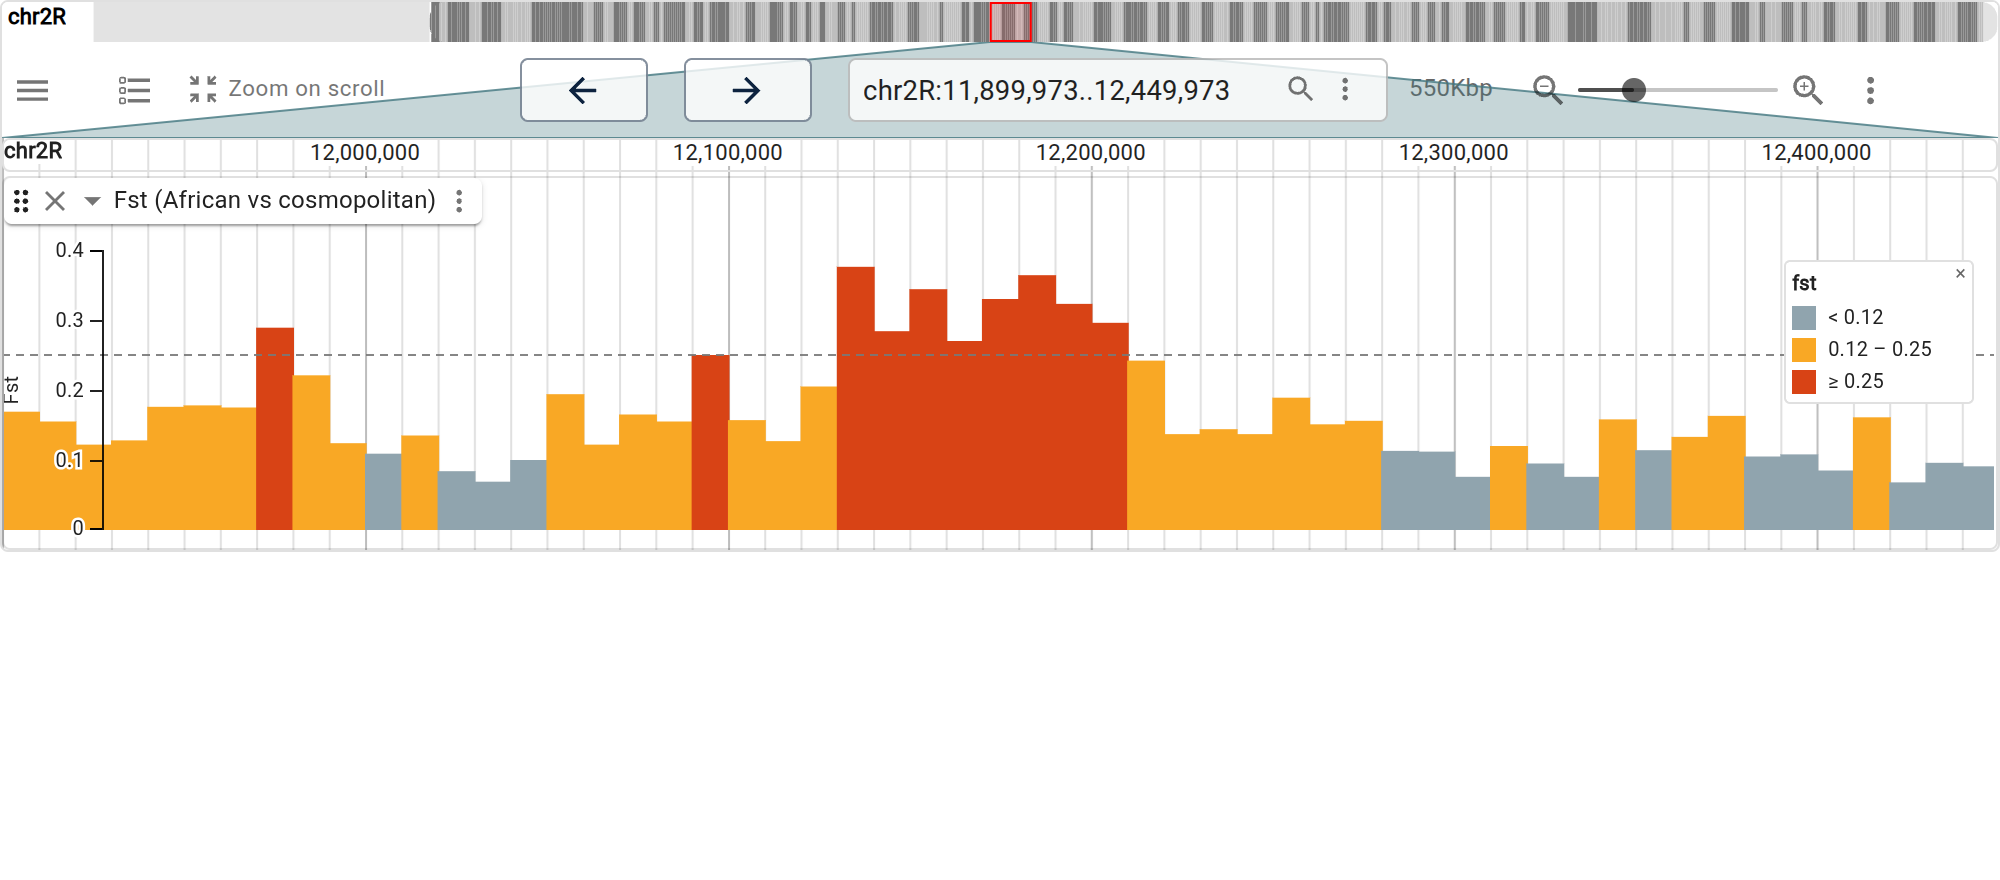
A displays entry plots the columns the way a grammar of graphics does: a LinearMarkDisplay maps a column to the value axis and another to a colour scale, and the axis, legend and reference lines follow from the scales. This is a windowed Fst scan between two Drosophila populations, computed in R:
JBrowseR(
  assembly = "dm6",
  tracks = list(track_data_frame(
    fst, "Fst (African vs cosmopolitan)",
    displays = list(list(
      type = "LinearMarkDisplay",
      scales = list(y = list(title = "Fst", rules = list(0.25))),
      marks = list(list(
        mark = "bar",
        encoding = list(
          y = "fst",
          color = list(
            field = "fst", scale = "threshold",
            domain = list(0.12, 0.25),
            range = list("#90a4ae", "#f9a825", "#d84315")
          )
        )
      ))
    ))
  )),
  location = "chr2R:11,900,000..12,450,000"
)
Files on your own machine need no host either — local_files reads them into the document, and a track refers to one by name as if it were a URL. The sibling index comes along, so an indexed file stays indexed and only the region on screen is ever read:
JBrowseR(
  assembly = "hg38",
  tracks = list(list(uri = "peaks.bed.gz", name = "Peaks")),
  local_files = "~/data/peaks.bed.gz",
  location = "17:43,000,000..43,125,000"
)
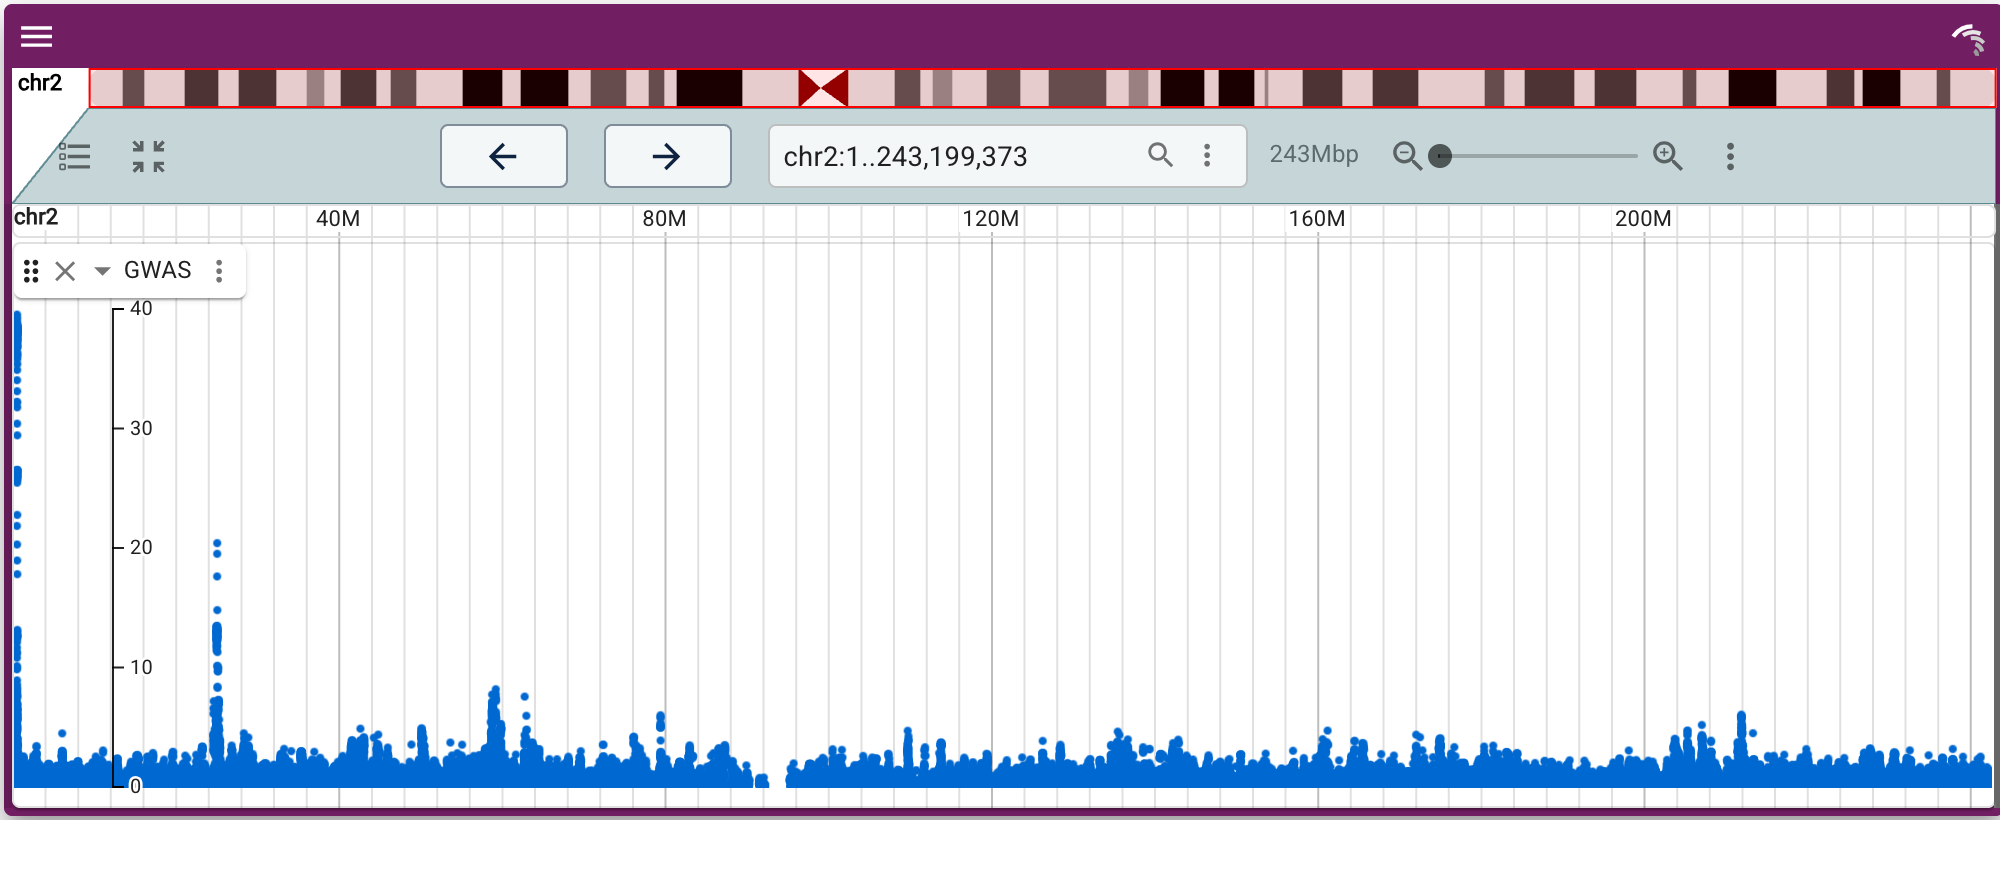
A track’s display can plot its data — a GWASTrack with a LinearManhattanDisplay draws genome-wide summary statistics as a Manhattan plot in the linear view, no separate plotting widget needed:
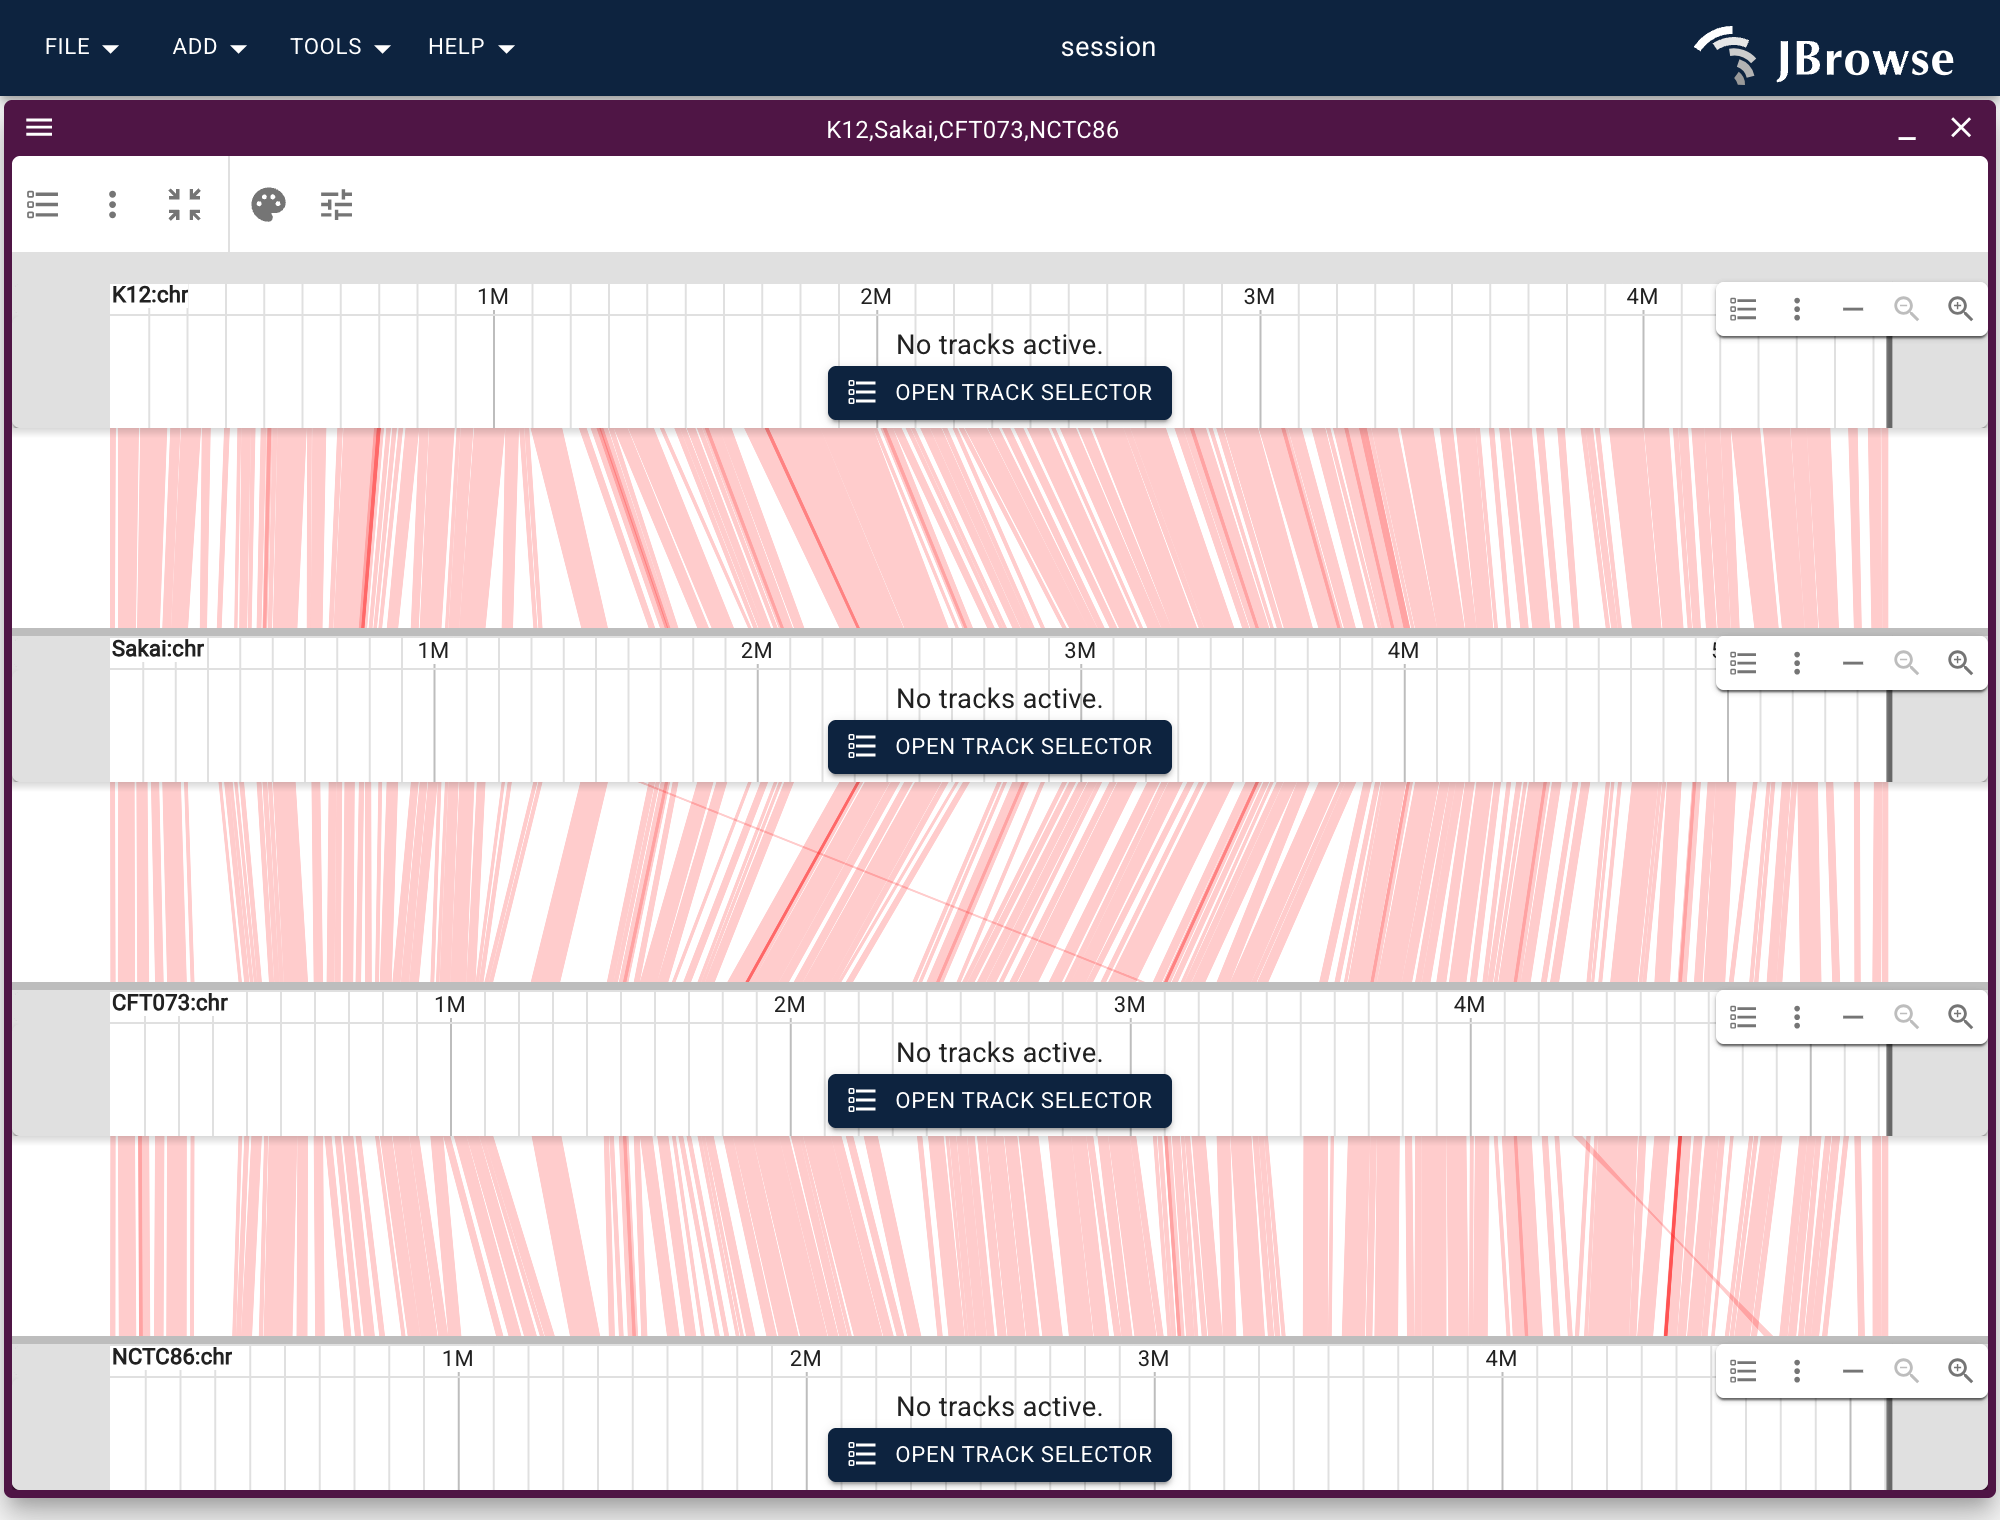
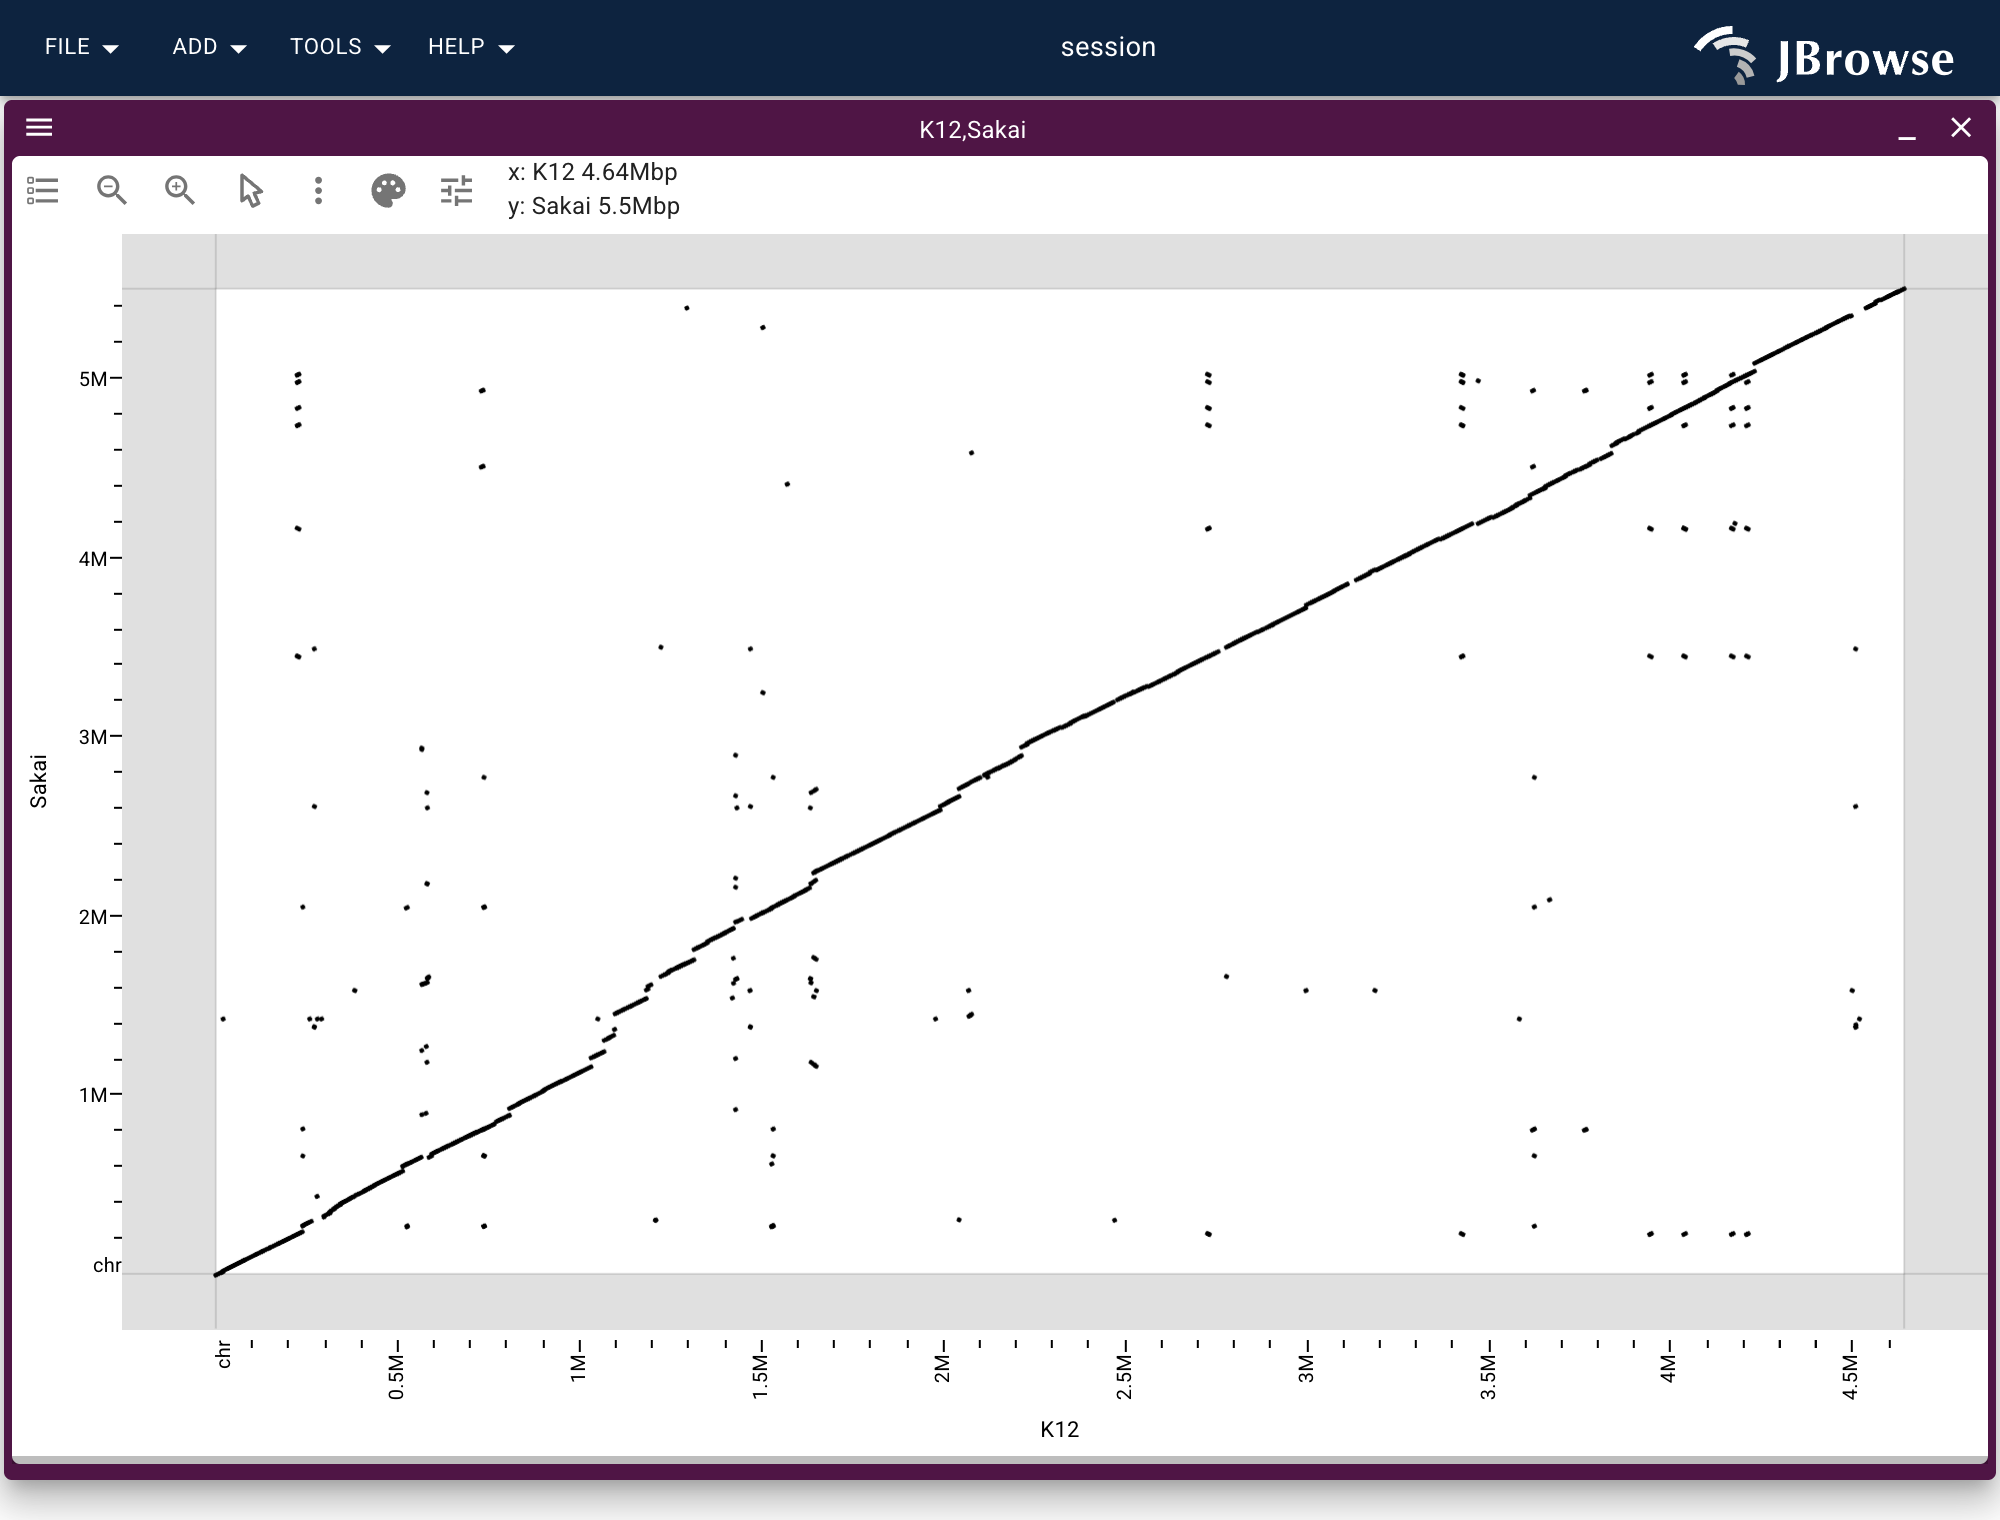
Compare whole genomes with JBrowseRApp() — several assemblies stacked, the blocks each pair shares drawn between the rows (here four E. coli strains tied by one all-vs-all alignment), or the same alignment as a whole-genome dotplot. See the comparative synteny vignette, or run it on Colab: 
Try it live
The figures above are screenshots so the package stays small, but the website hosts the same browsers as real, interactive widgets — pan, zoom, and click features in the page:
- Live embedded browsers — a hub genome, a custom FASTA, an R data frame as a track, and a GWAS Manhattan plot
- Comparing genomes, live — a linear synteny view and a dotplot
For the Shiny side, JBrowseR demos is every example app in one place — gene search, a data frame as a track, a slider that re-runs the analysis, SKBR3 structural variants, a browser kept in a JSON file, and a plugin.
Getting started
See the vignettes:
- Introduction — the declarative API and a gallery of demos
- Custom browser tutorial — build a browser for your own assembly and data
- Hosting data — CORS + range-request requirements, and viewing local files
- A browser in a JSON file — options kept in JSON
Citation
If you use JBrowseR in your research, please cite:
Hershberg et al., 2021. JBrowseR: An R Interface to the JBrowse 2 Genome Browser
For developers
The R package ships a prebuilt JavaScript bundle in inst/htmlwidgets/. To rebuild it against a local checkout of jbrowse-components (expected as a sibling directory), install pnpm and run:
