Two kinds of example: the standalone react-msaview viewer, where the
biology reads straight off the alignment and tree, and react-msaview
running inside JBrowse, connected to a genome view and 3D structure. Each
is built reproducibly from public data by the scripts in the repo. Build
your own from any gene on the
gene explorer.
Standalone react-msaview
Just an alignment, a tree, and optional feature overlays — no genome
browser. Each figure below shows a distinct viewer capability — domain
overlays, reference diffing, tree topology, RNA secondary structure, gene
arrows, base-resolution DNA, scale. The full set of biological examples
(more conservation, phylogeny, and domain stories) is live and interactive
on the
examples page.
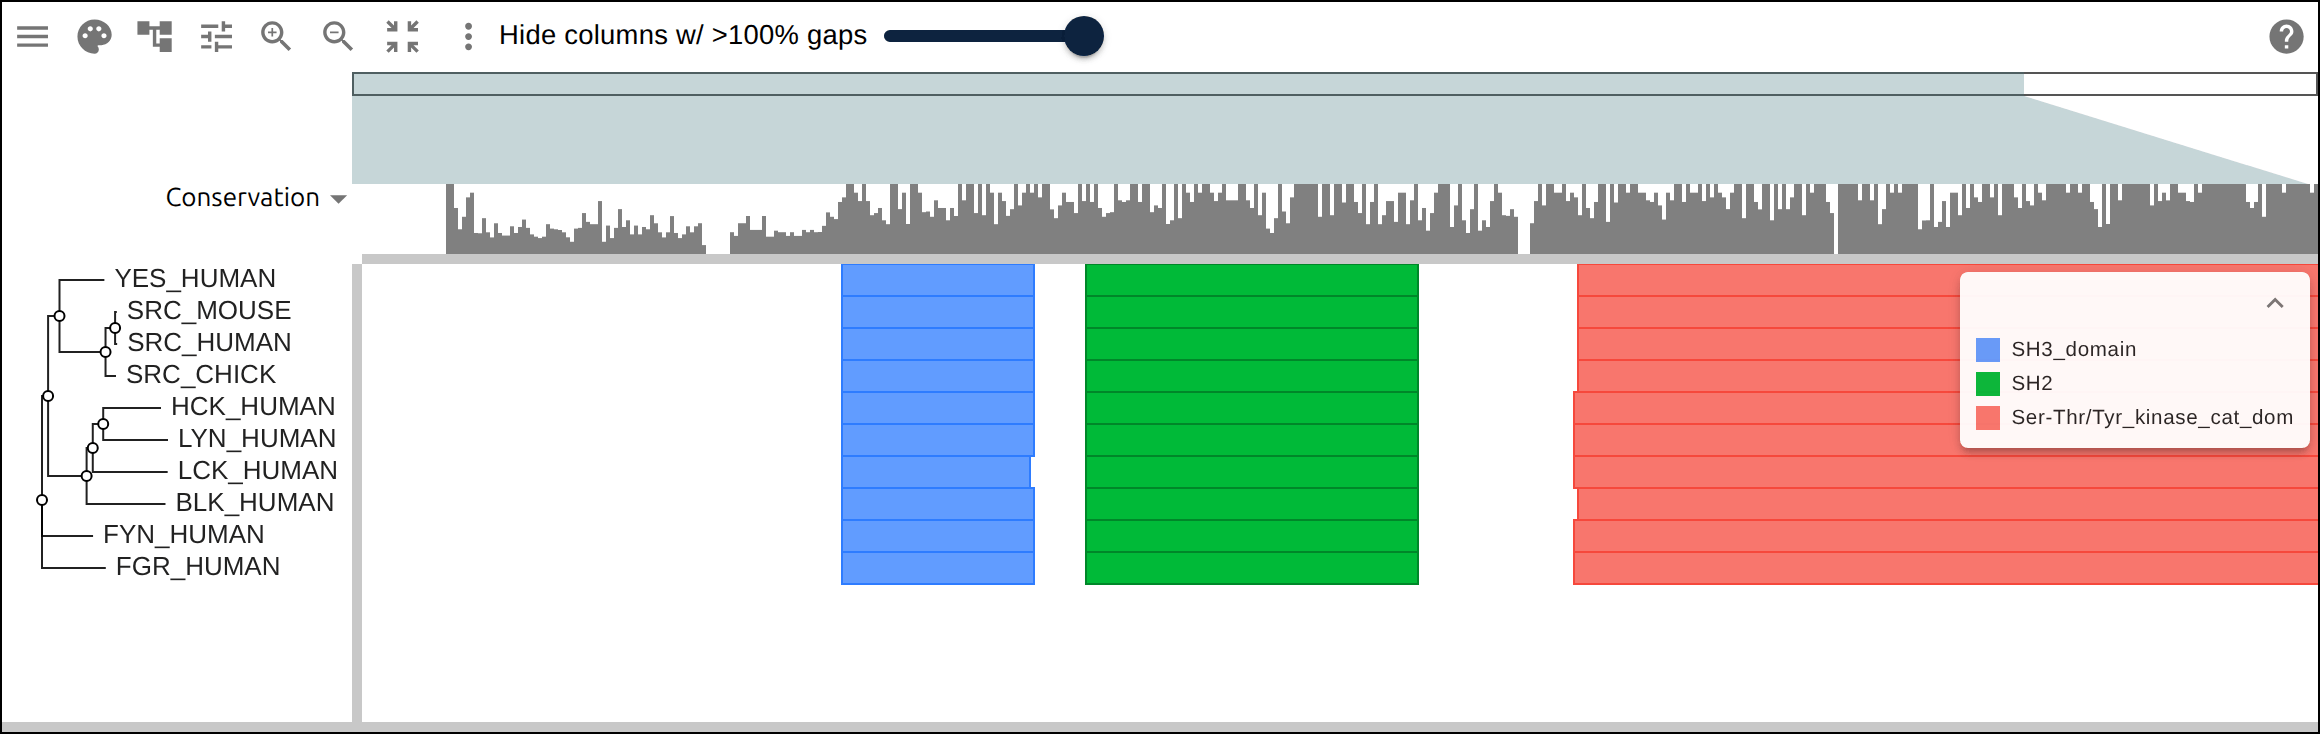
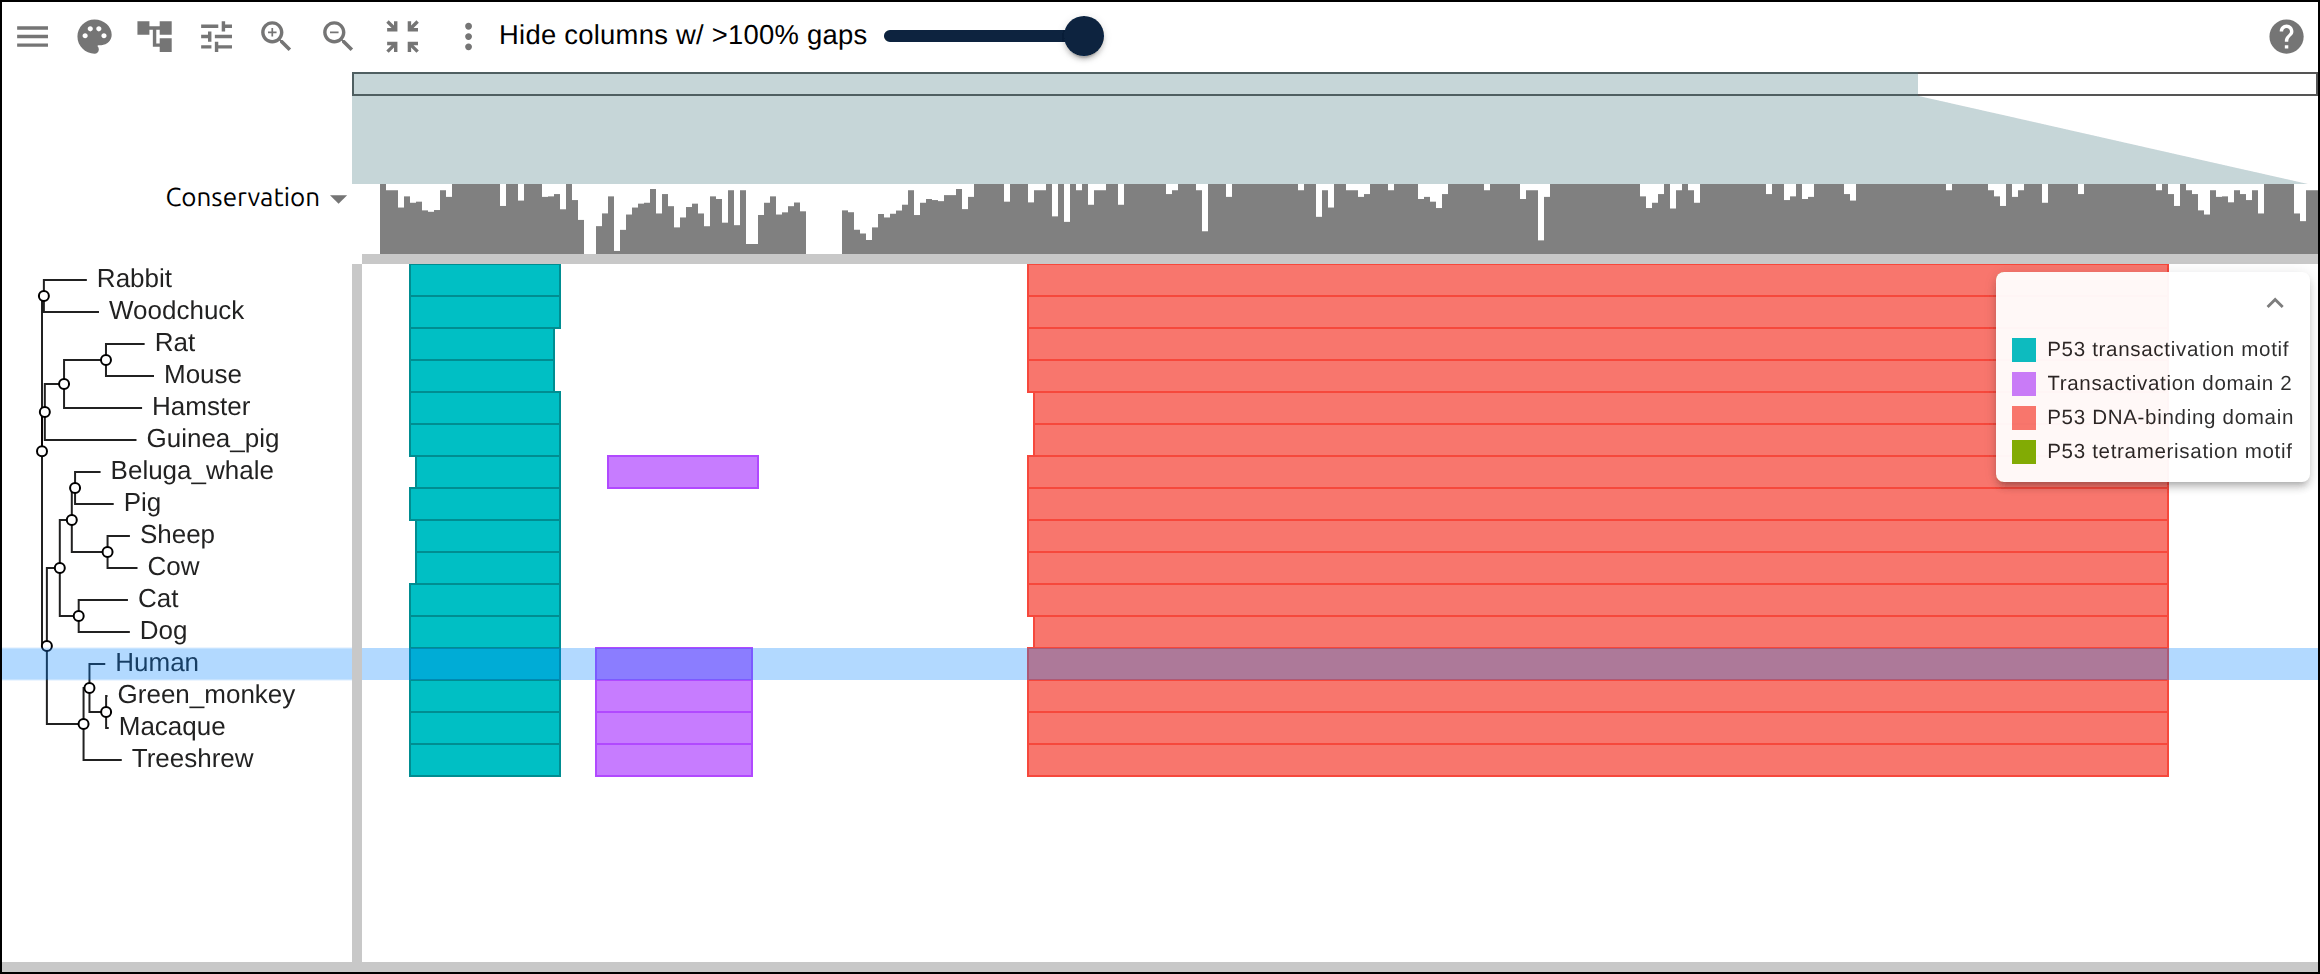
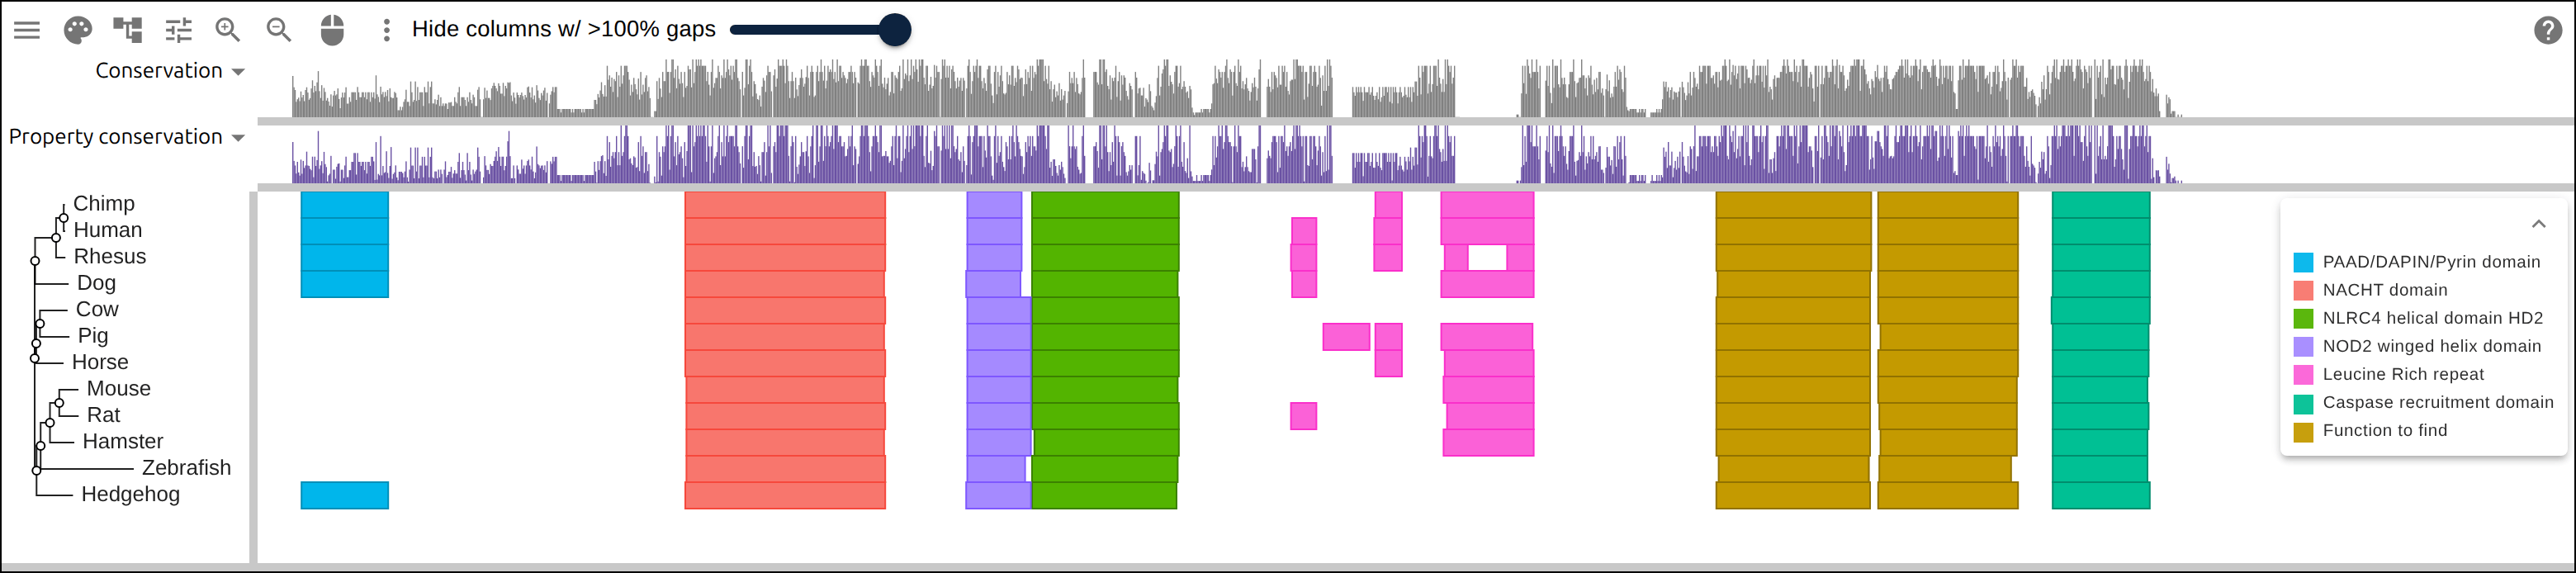
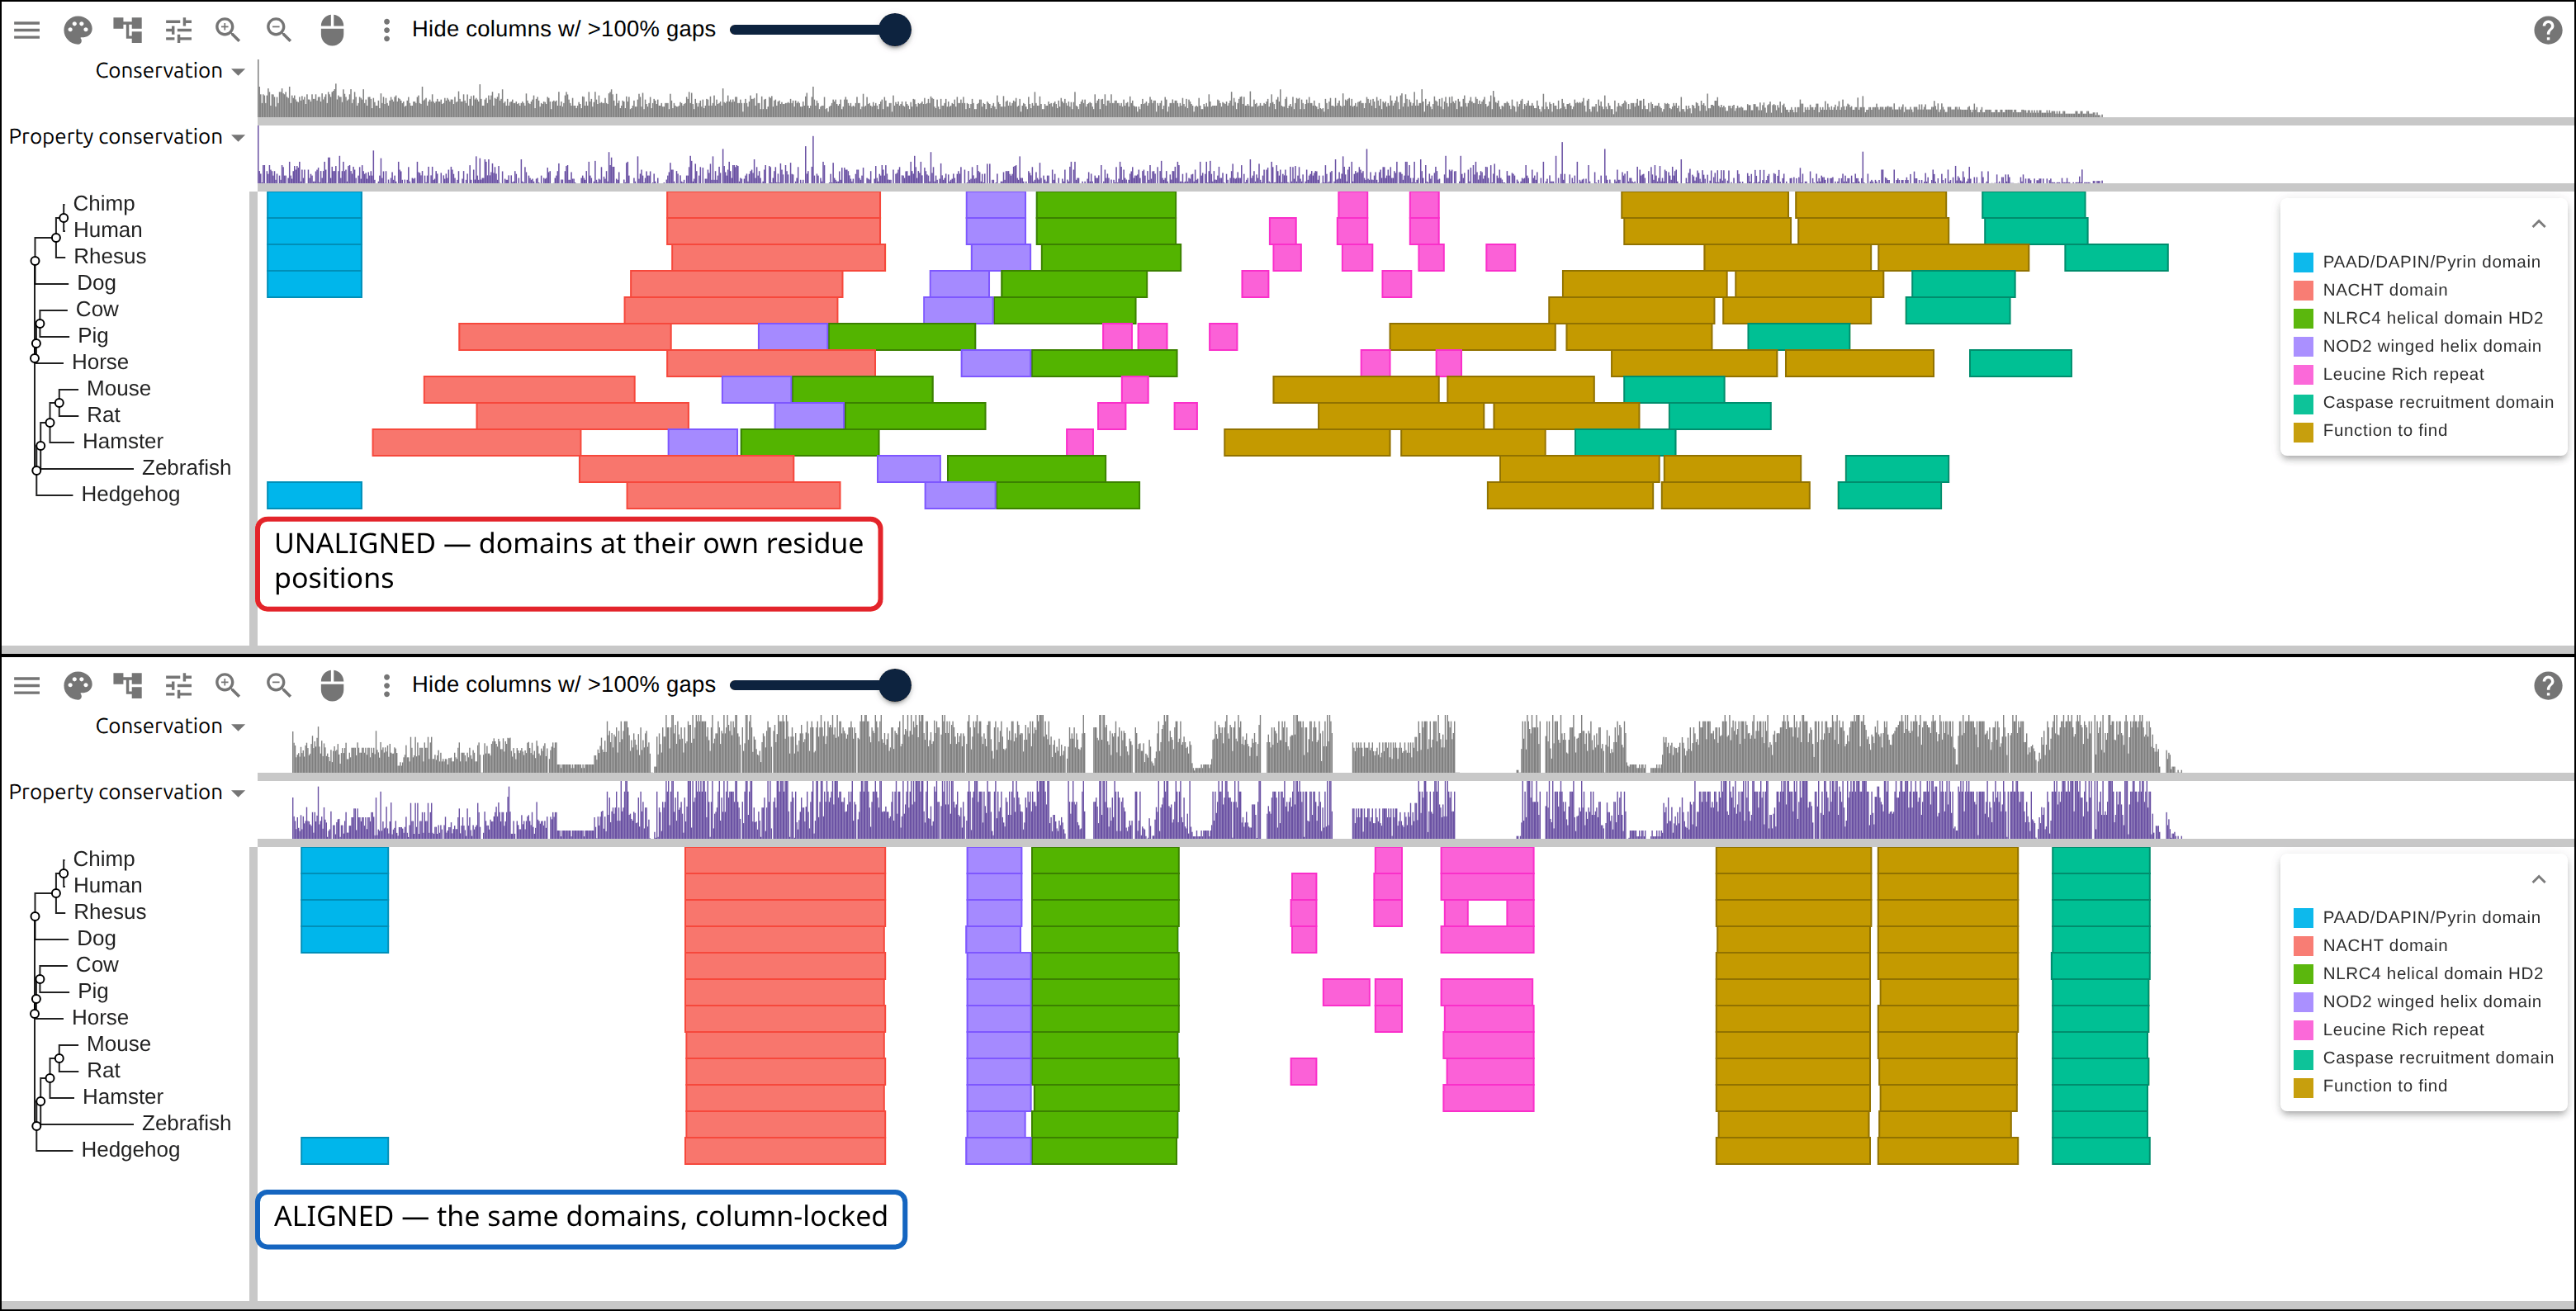
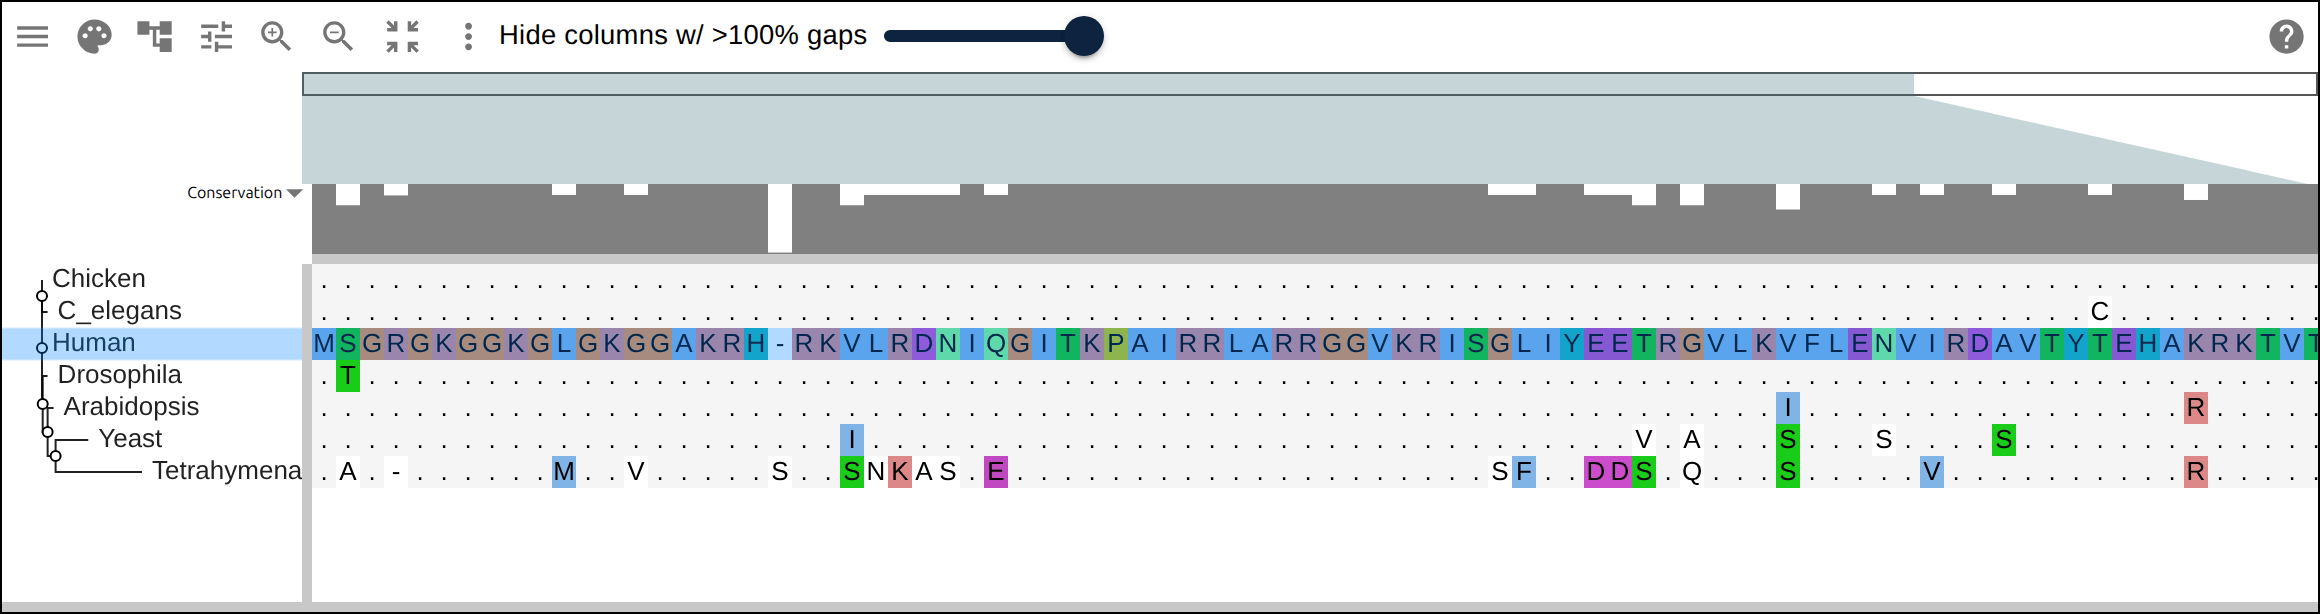
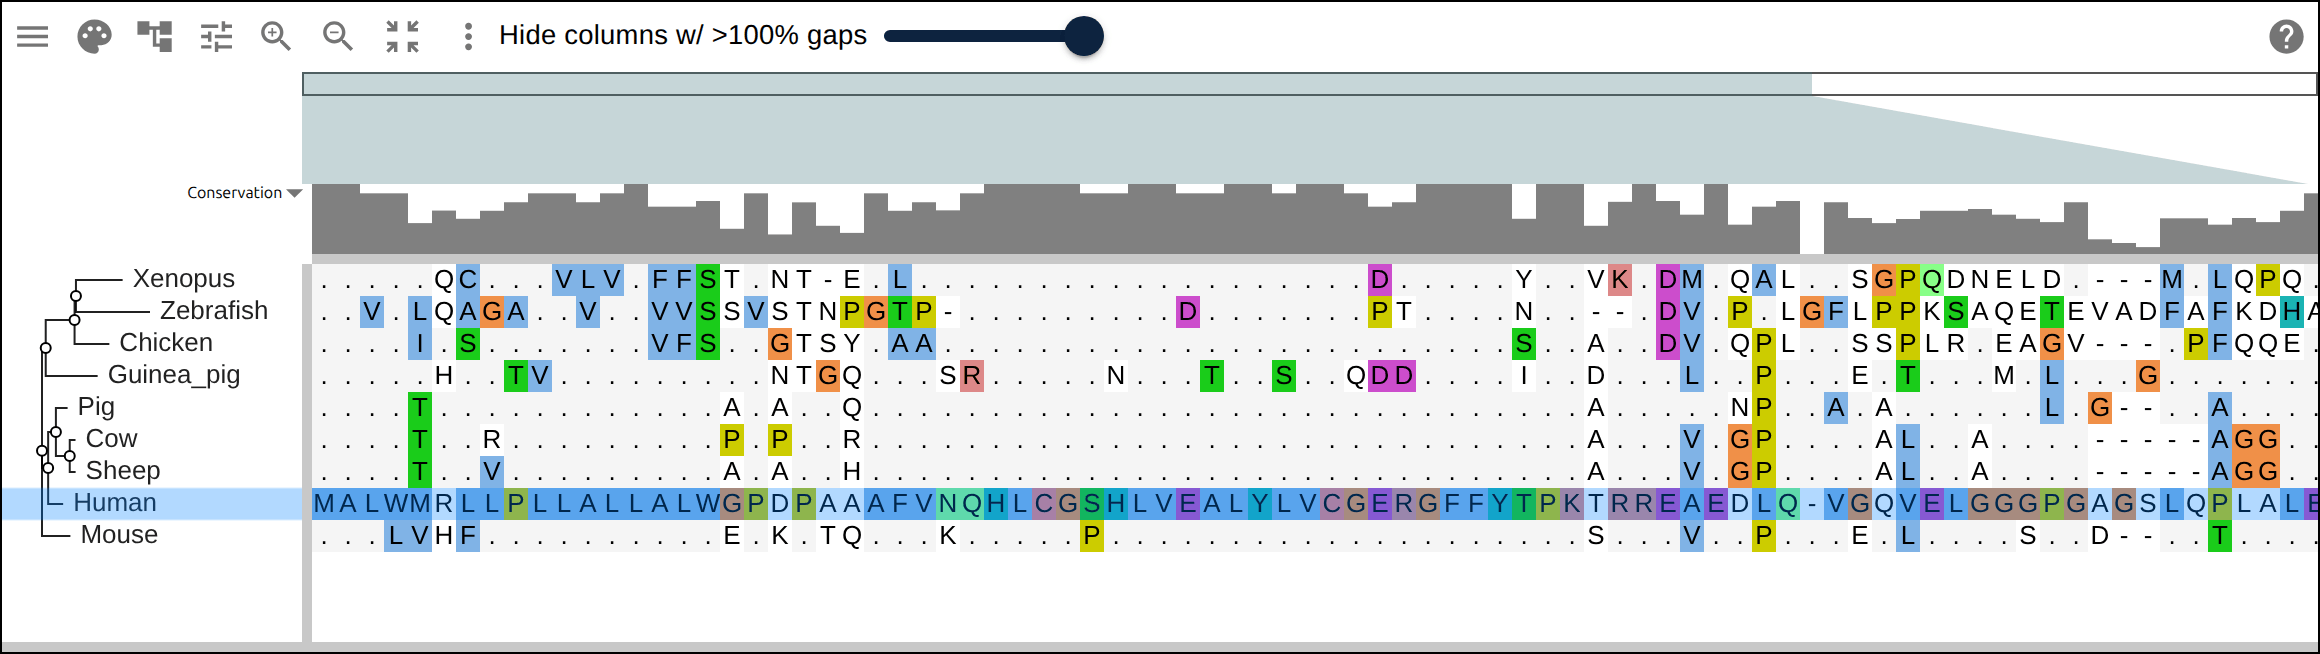
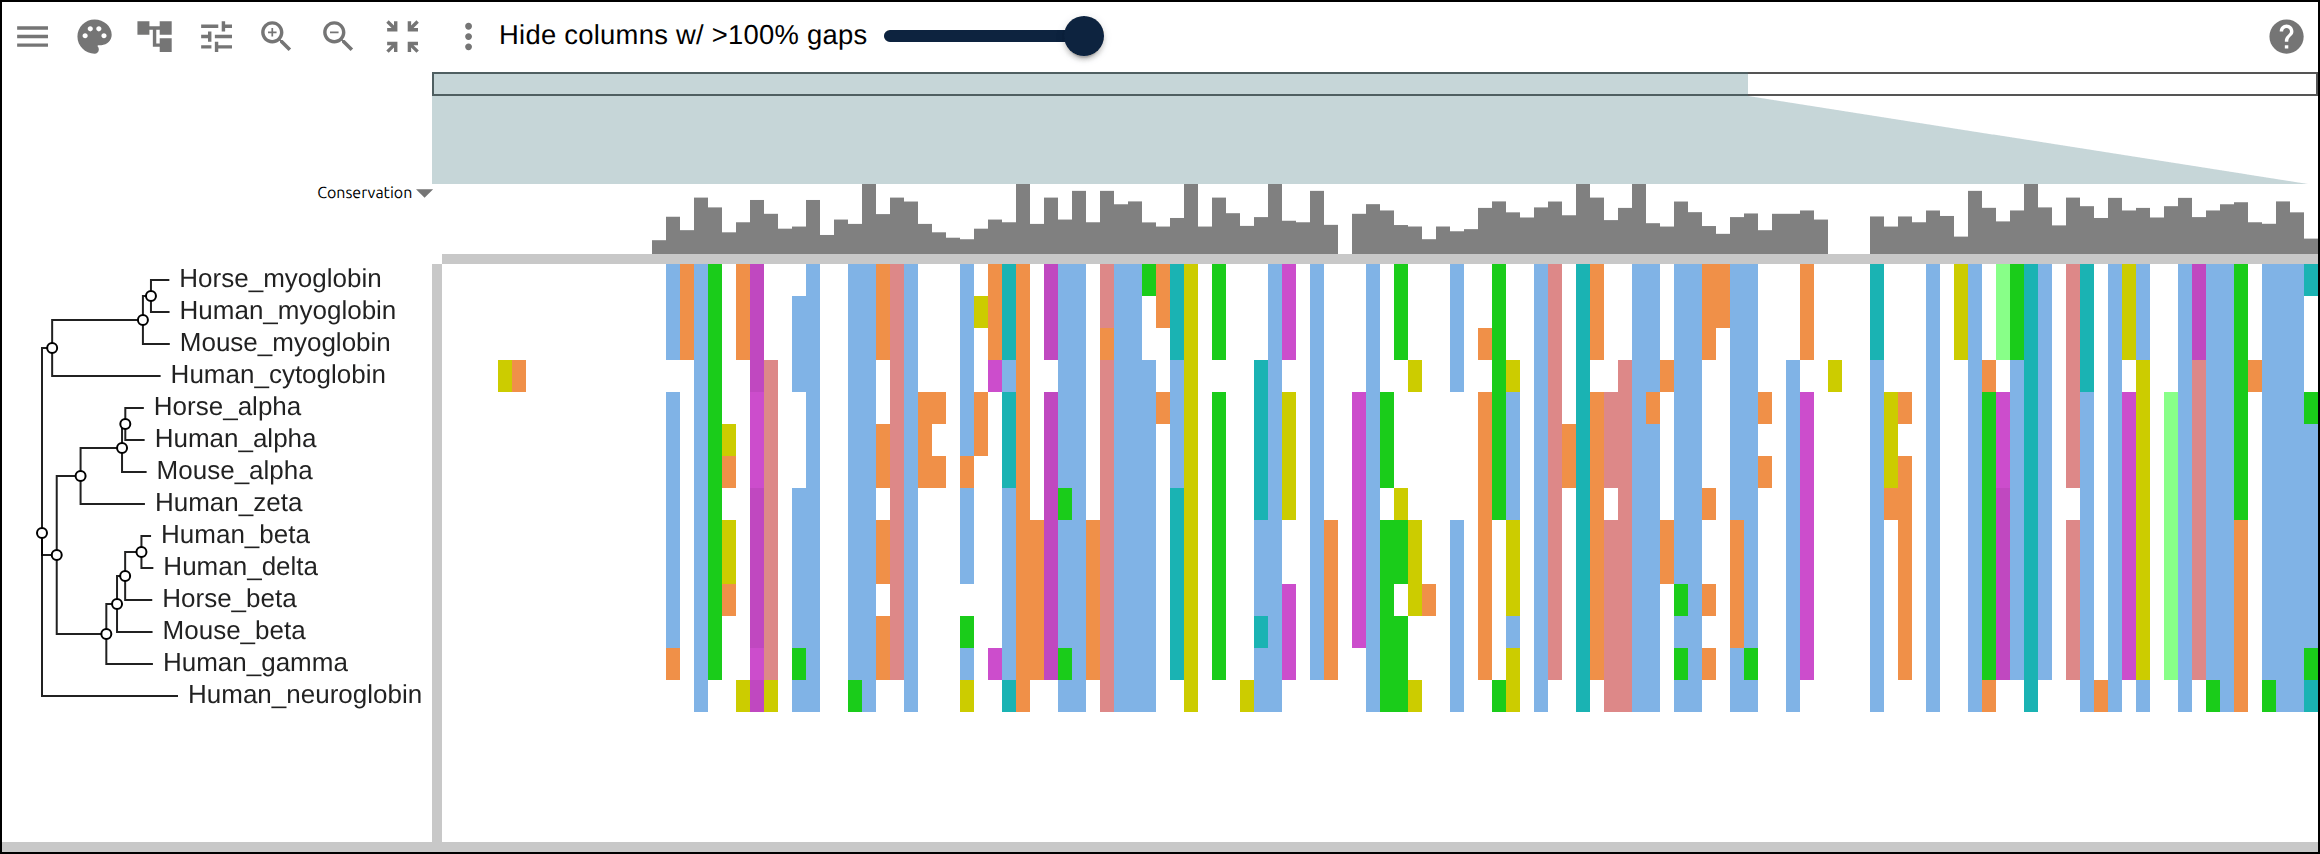
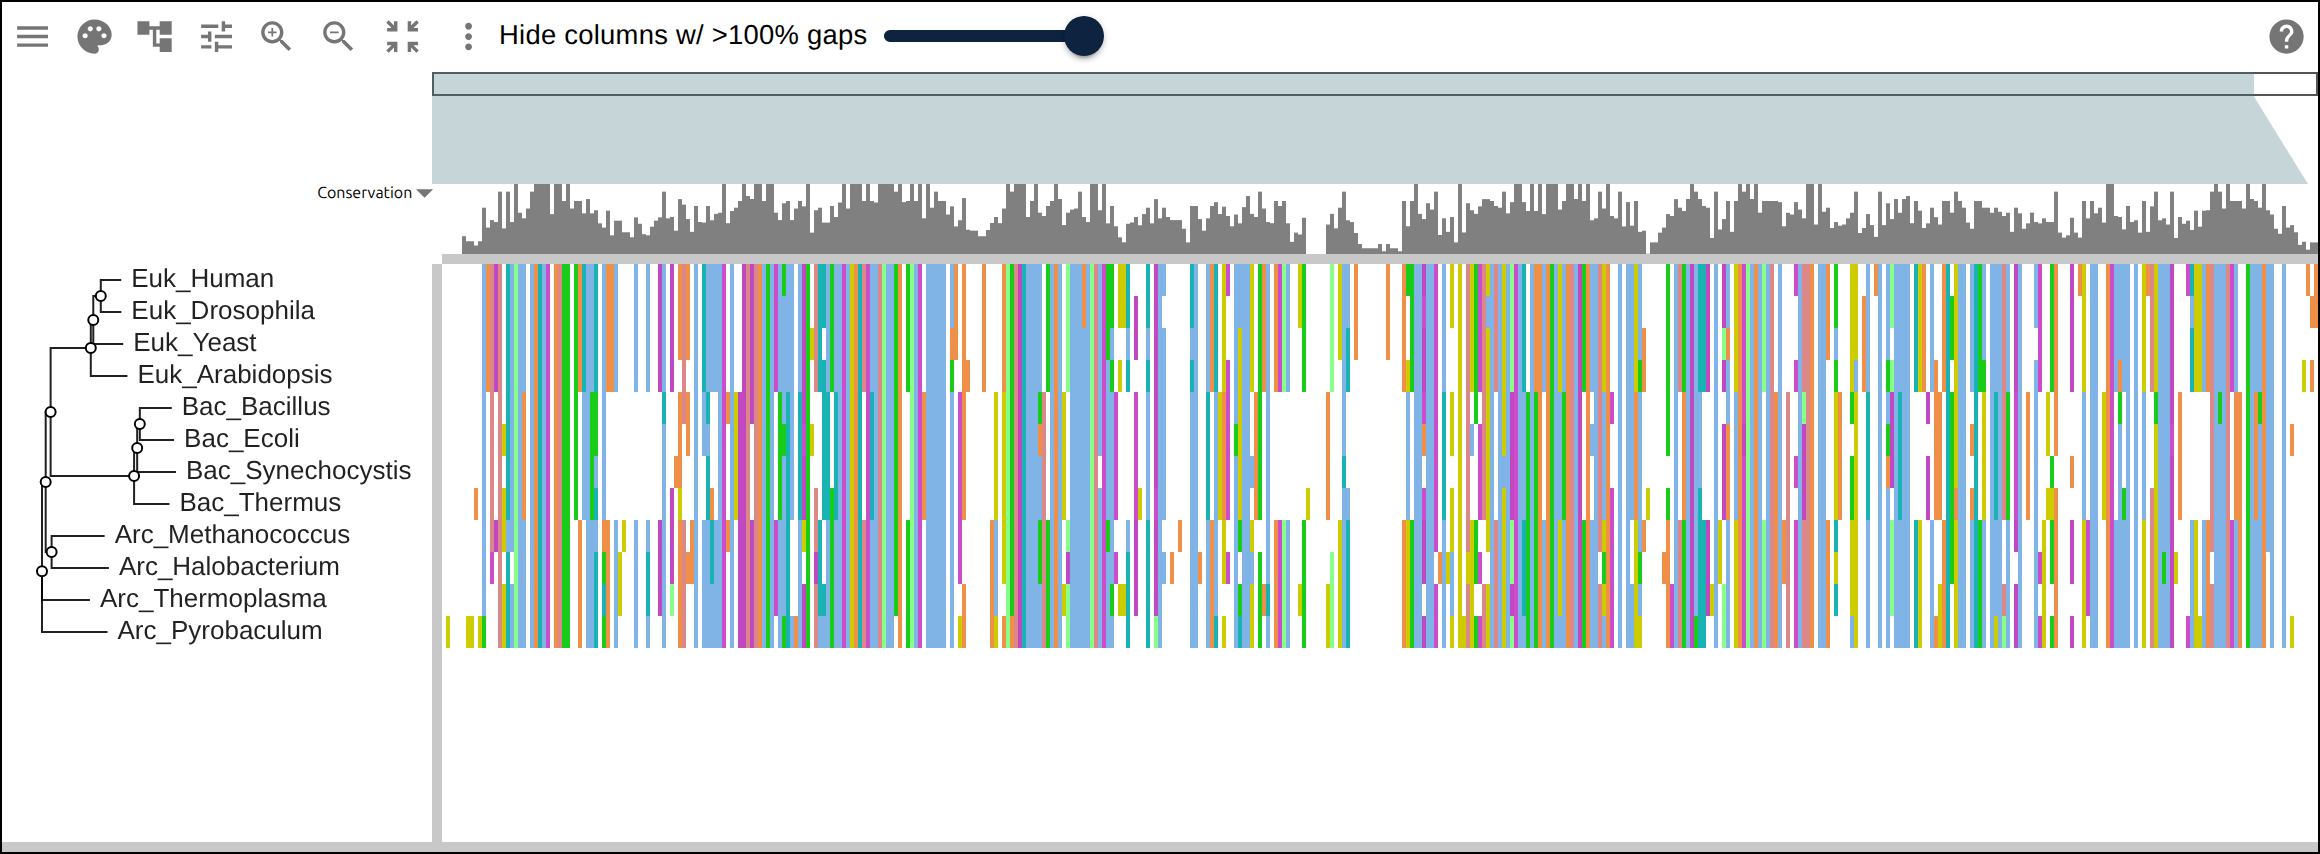
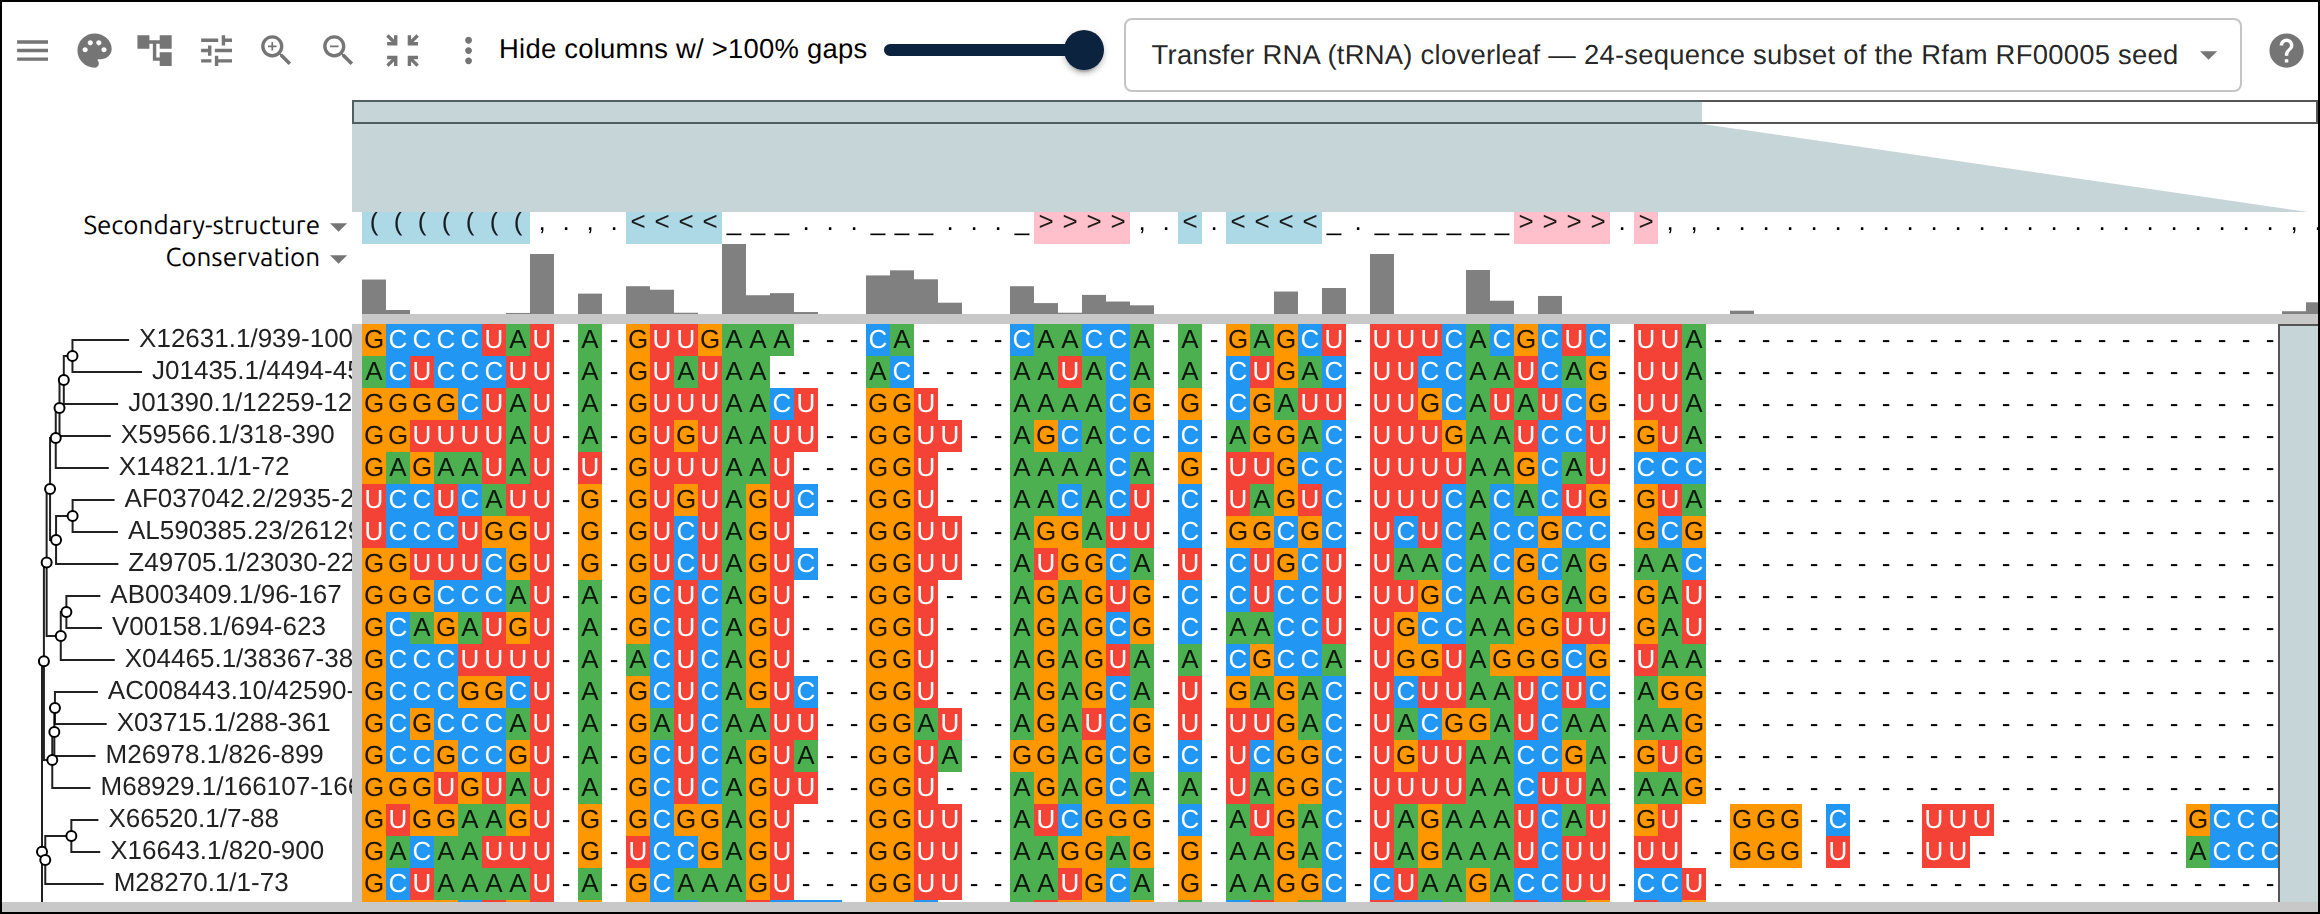
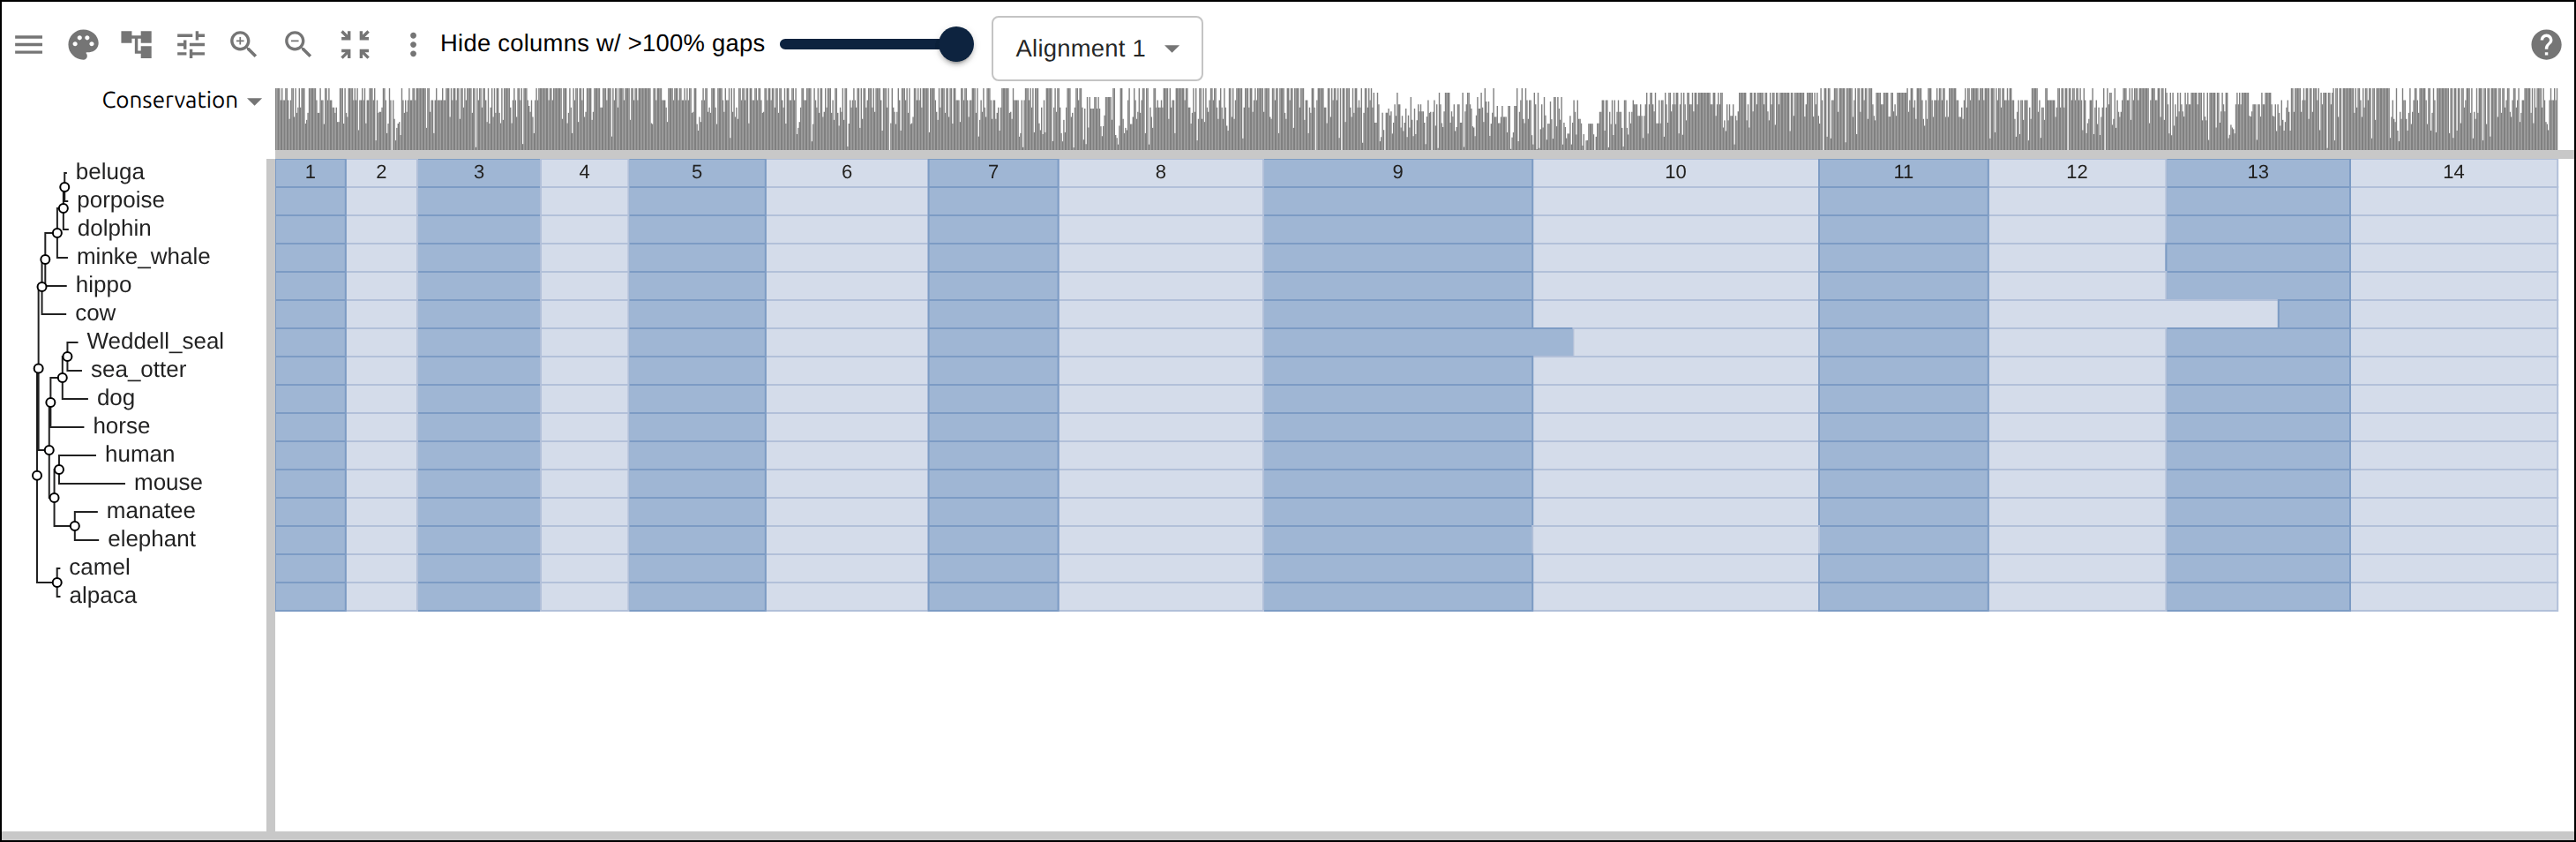
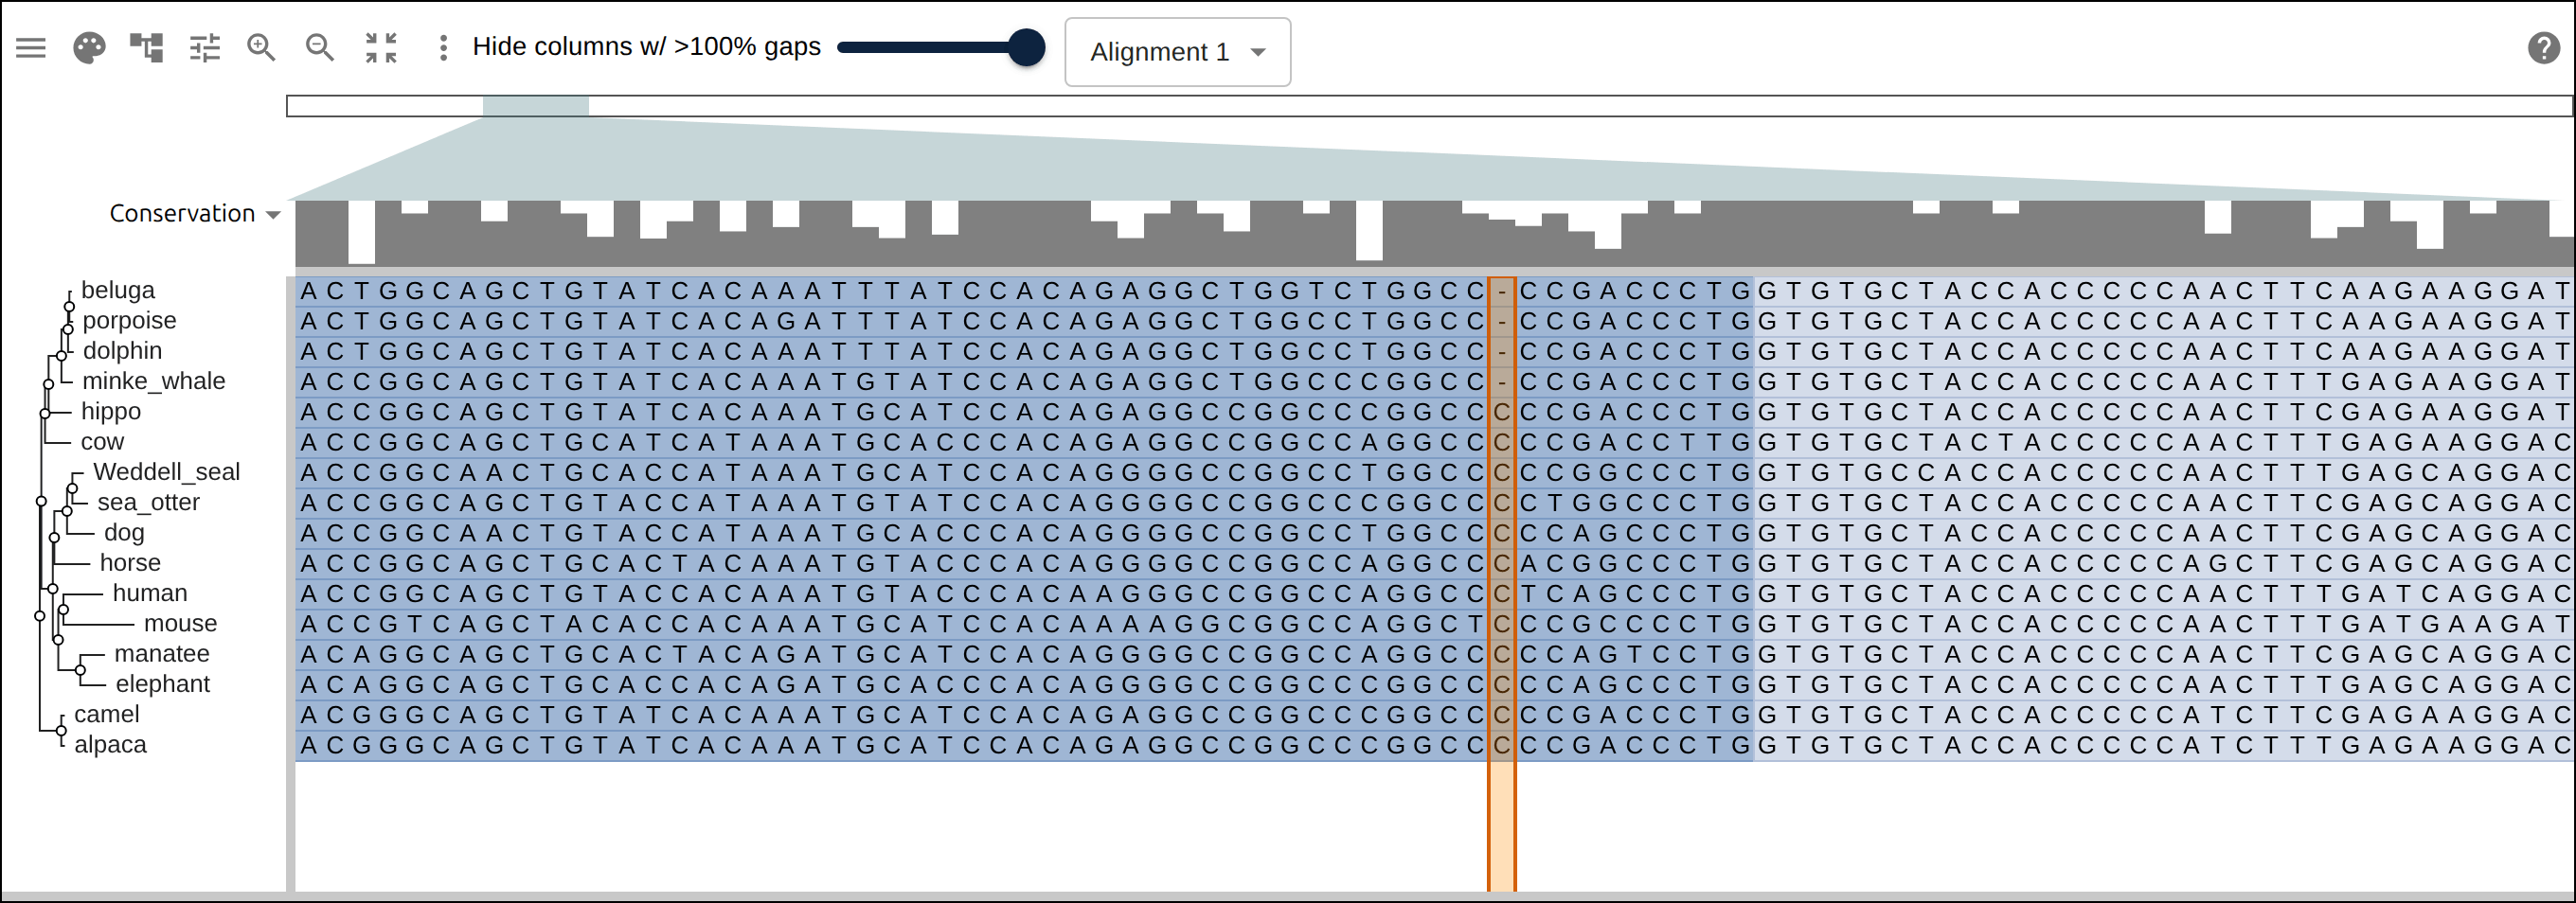
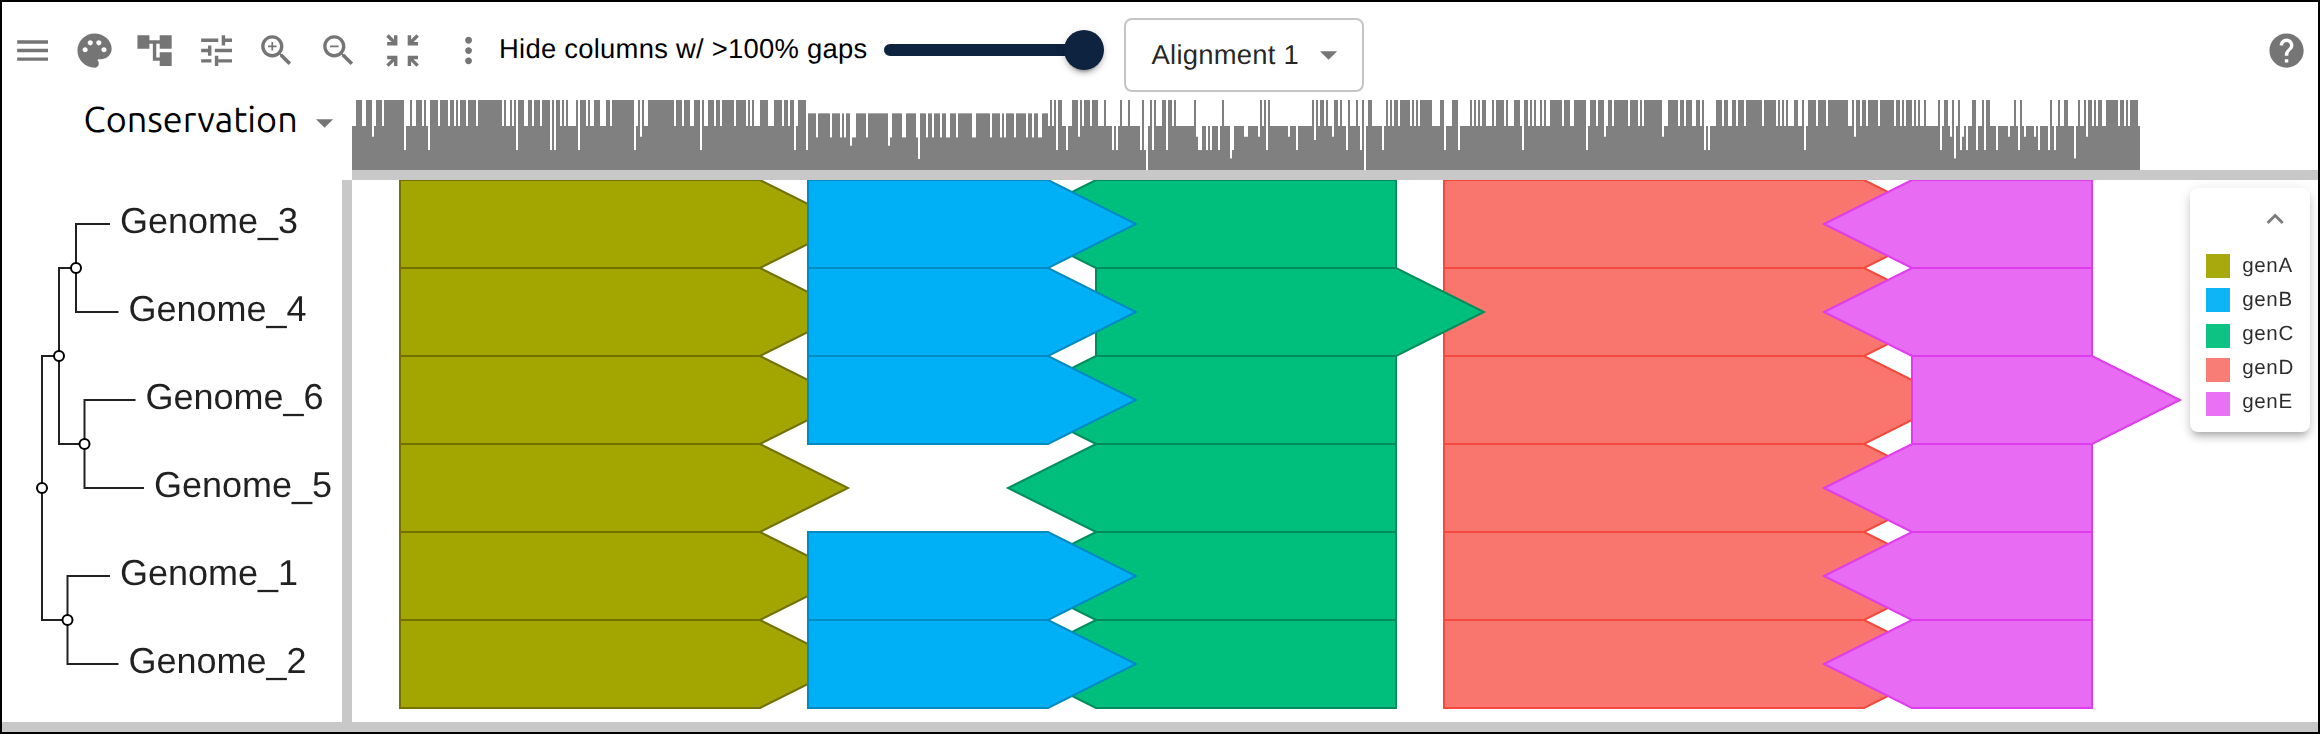
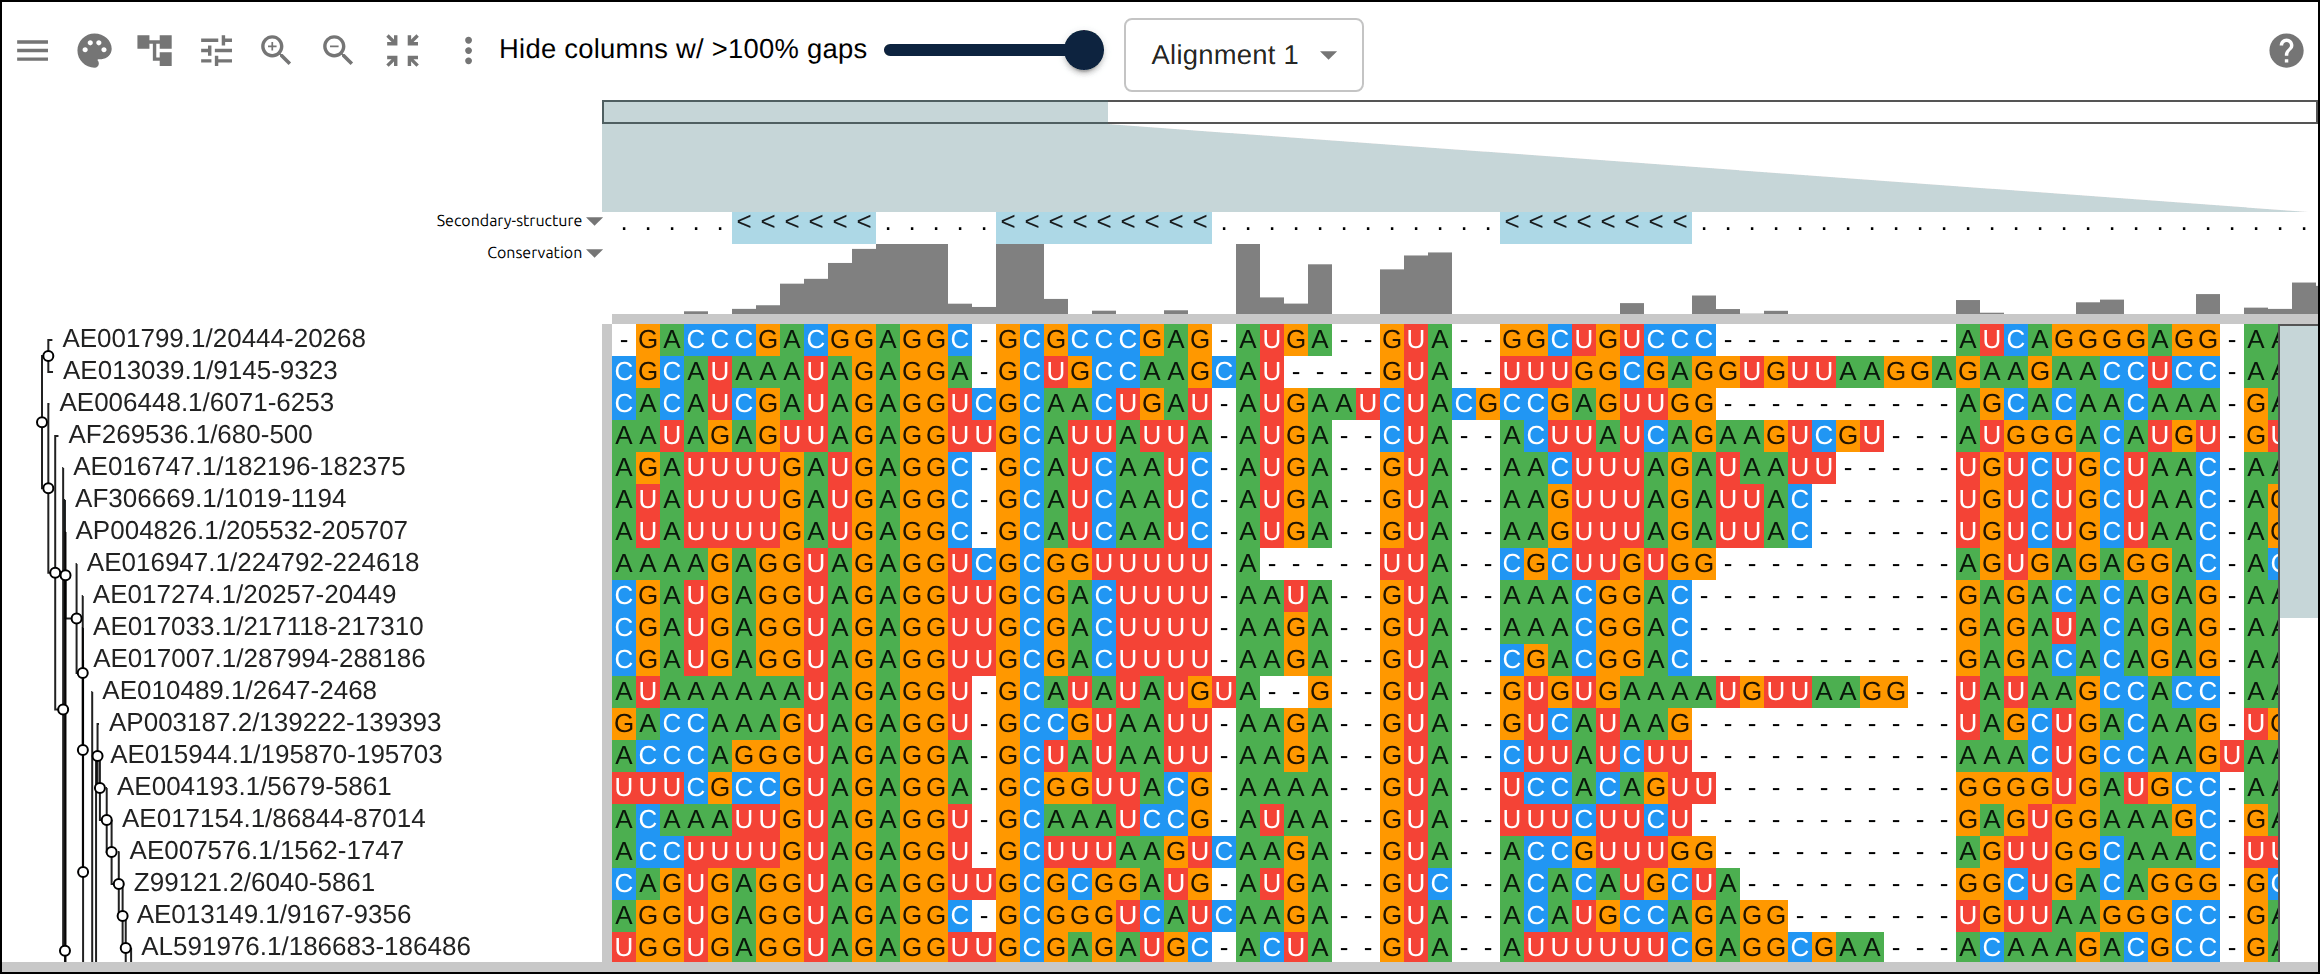
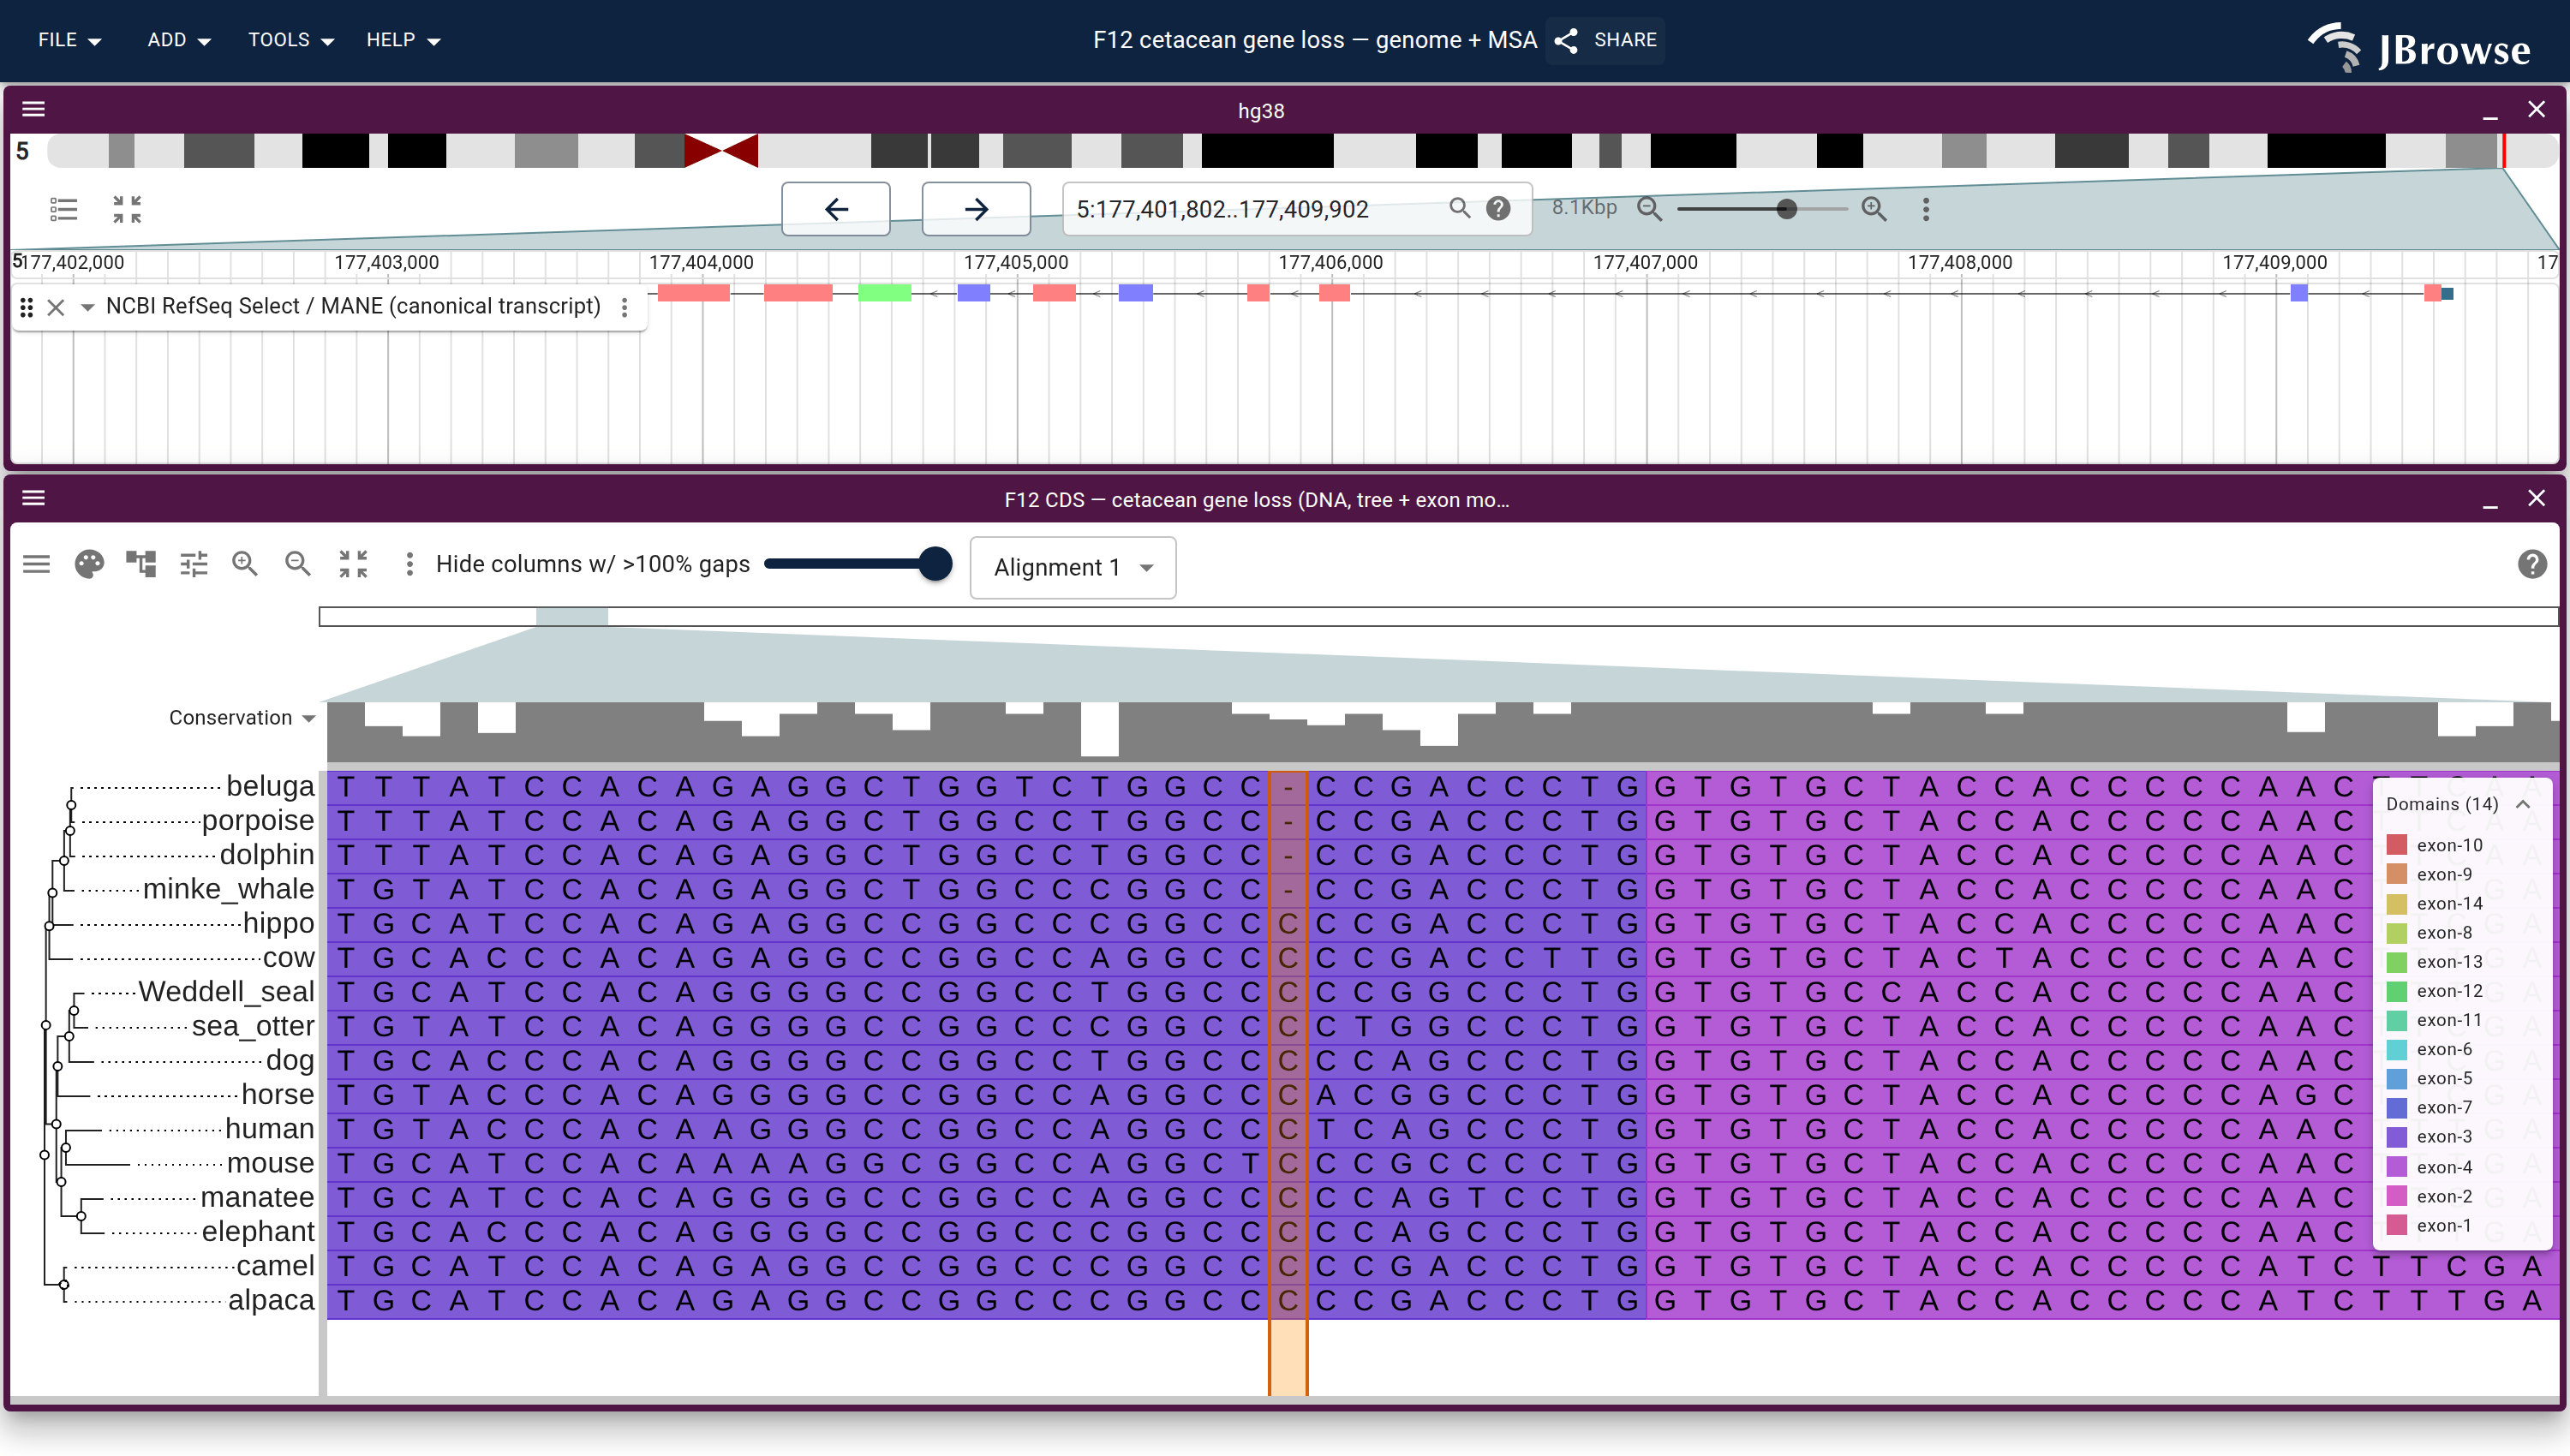
Domain architecture — The Src-family kinases with InterProScan annotations: the shared SH3 + SH2 + kinase domain blocks line up down every member, so the family’s domain layout reads straight across the alignment.A dominant functional domain — p53’s InterProScan domains overlaid: the central DNA-binding domain (red) — where most cancer mutations cluster — forms the bulk of the protein, flanked by the short N-terminal transactivation motifs. The overlay maps the functional architecture onto the alignment.Domain loss across orthologs — Twelve NLRP1 orthologs. Every row carries the same core — NACHT, winged helix, HD2, then FIIND/UPA and the CARD — and every one of those blocks lines up in the same columns. The N-terminal PYD (cyan) is there in only five rows, so the blank space under it is a module the other seven lack. Those core domains sit up to 391 residues apart between rows in their own coordinates; column-locking is what stacks them.Why the domain overlay is column-locked — The same twelve NLRP1 orthologs, the same domain GFF, the same palette and tree — the only difference is whether the input was aligned. Unaligned (top), column N is residue N and the shared domains scatter into a staircase. Aligned (bottom), they land in the same columns: NACHT starts at residue 328 in human and 93 in hamster, and both are drawn within one column of each other.Reference comparison (dots) — Diffing against a reference (relativeTo) collapses identical residues to dots so only the changes stand out. Histone H4, one of the most conserved proteins known, is almost entirely dots relative to human — only the most distant lineages differ.Post-translational processing — Insulin relative to human: the mature B and A chains stay conserved (dots) while the cleaved-out C-peptide drifts (letters) — the same dot-diffing reading out where a protein is under selection.Gene duplication — The globin family groups by globin type across species rather than by species — alpha beside alpha, beta beside beta — the signature of ancient gene duplication read off the tree.Tree of life — Elongation factor EF-1α/EF-Tu across bacteria, archaea, and eukaryotes — the label prefixes make the three domains of life read straight off a single inferred tree.RNA secondary structure — A tRNA alignment (Rfam RF00005): the Stockholm SS_cons cloverleaf renders as a dedicated secondary-structure track above the columns, with the acceptor stem and D-/anticodon-/T-arms colored by base-pairing.Gene structure overlay (DNA) — Coagulation factor XII coding alignment with its 14 exons overlaid — each exon the same color across species, through the same overlay path as InterProScan domains (built by react-msaview-cli genestructure). The whole gene’s exon architecture reads straight down the alignment.Pseudogenization (base resolution) — Zoomed to single nucleotides: F12 is intact in land mammals and the manatee, but a single-base deletion shared by exactly the four cetaceans — beside premature stops elsewhere — disables it. Gene loss visible at the base level, which a protein alignment cannot show.Gene-arrow map — A gggenes-style gene cluster across genomes, each gene a strand-directed arrow anchored to alignment columns: one gene is inverted (the arrow flips) and one deleted (its columns gap out), yet every gene stays column-aligned.Scale — A real ~60-sequence lysine-riboswitch family and its full inferred tree, rendered through the tiled canvas system that keeps large alignments responsive.
Inside JBrowse
react-msaview also runs as a
JBrowse 2 plugin: the alignment and tree open inside JBrowse, connected to a genome
view and — with
protein3d — the
AlphaFold structure. Selecting a region in any view lights the matching columns,
codons, and residues in the others. Each example below is one declarative URL.
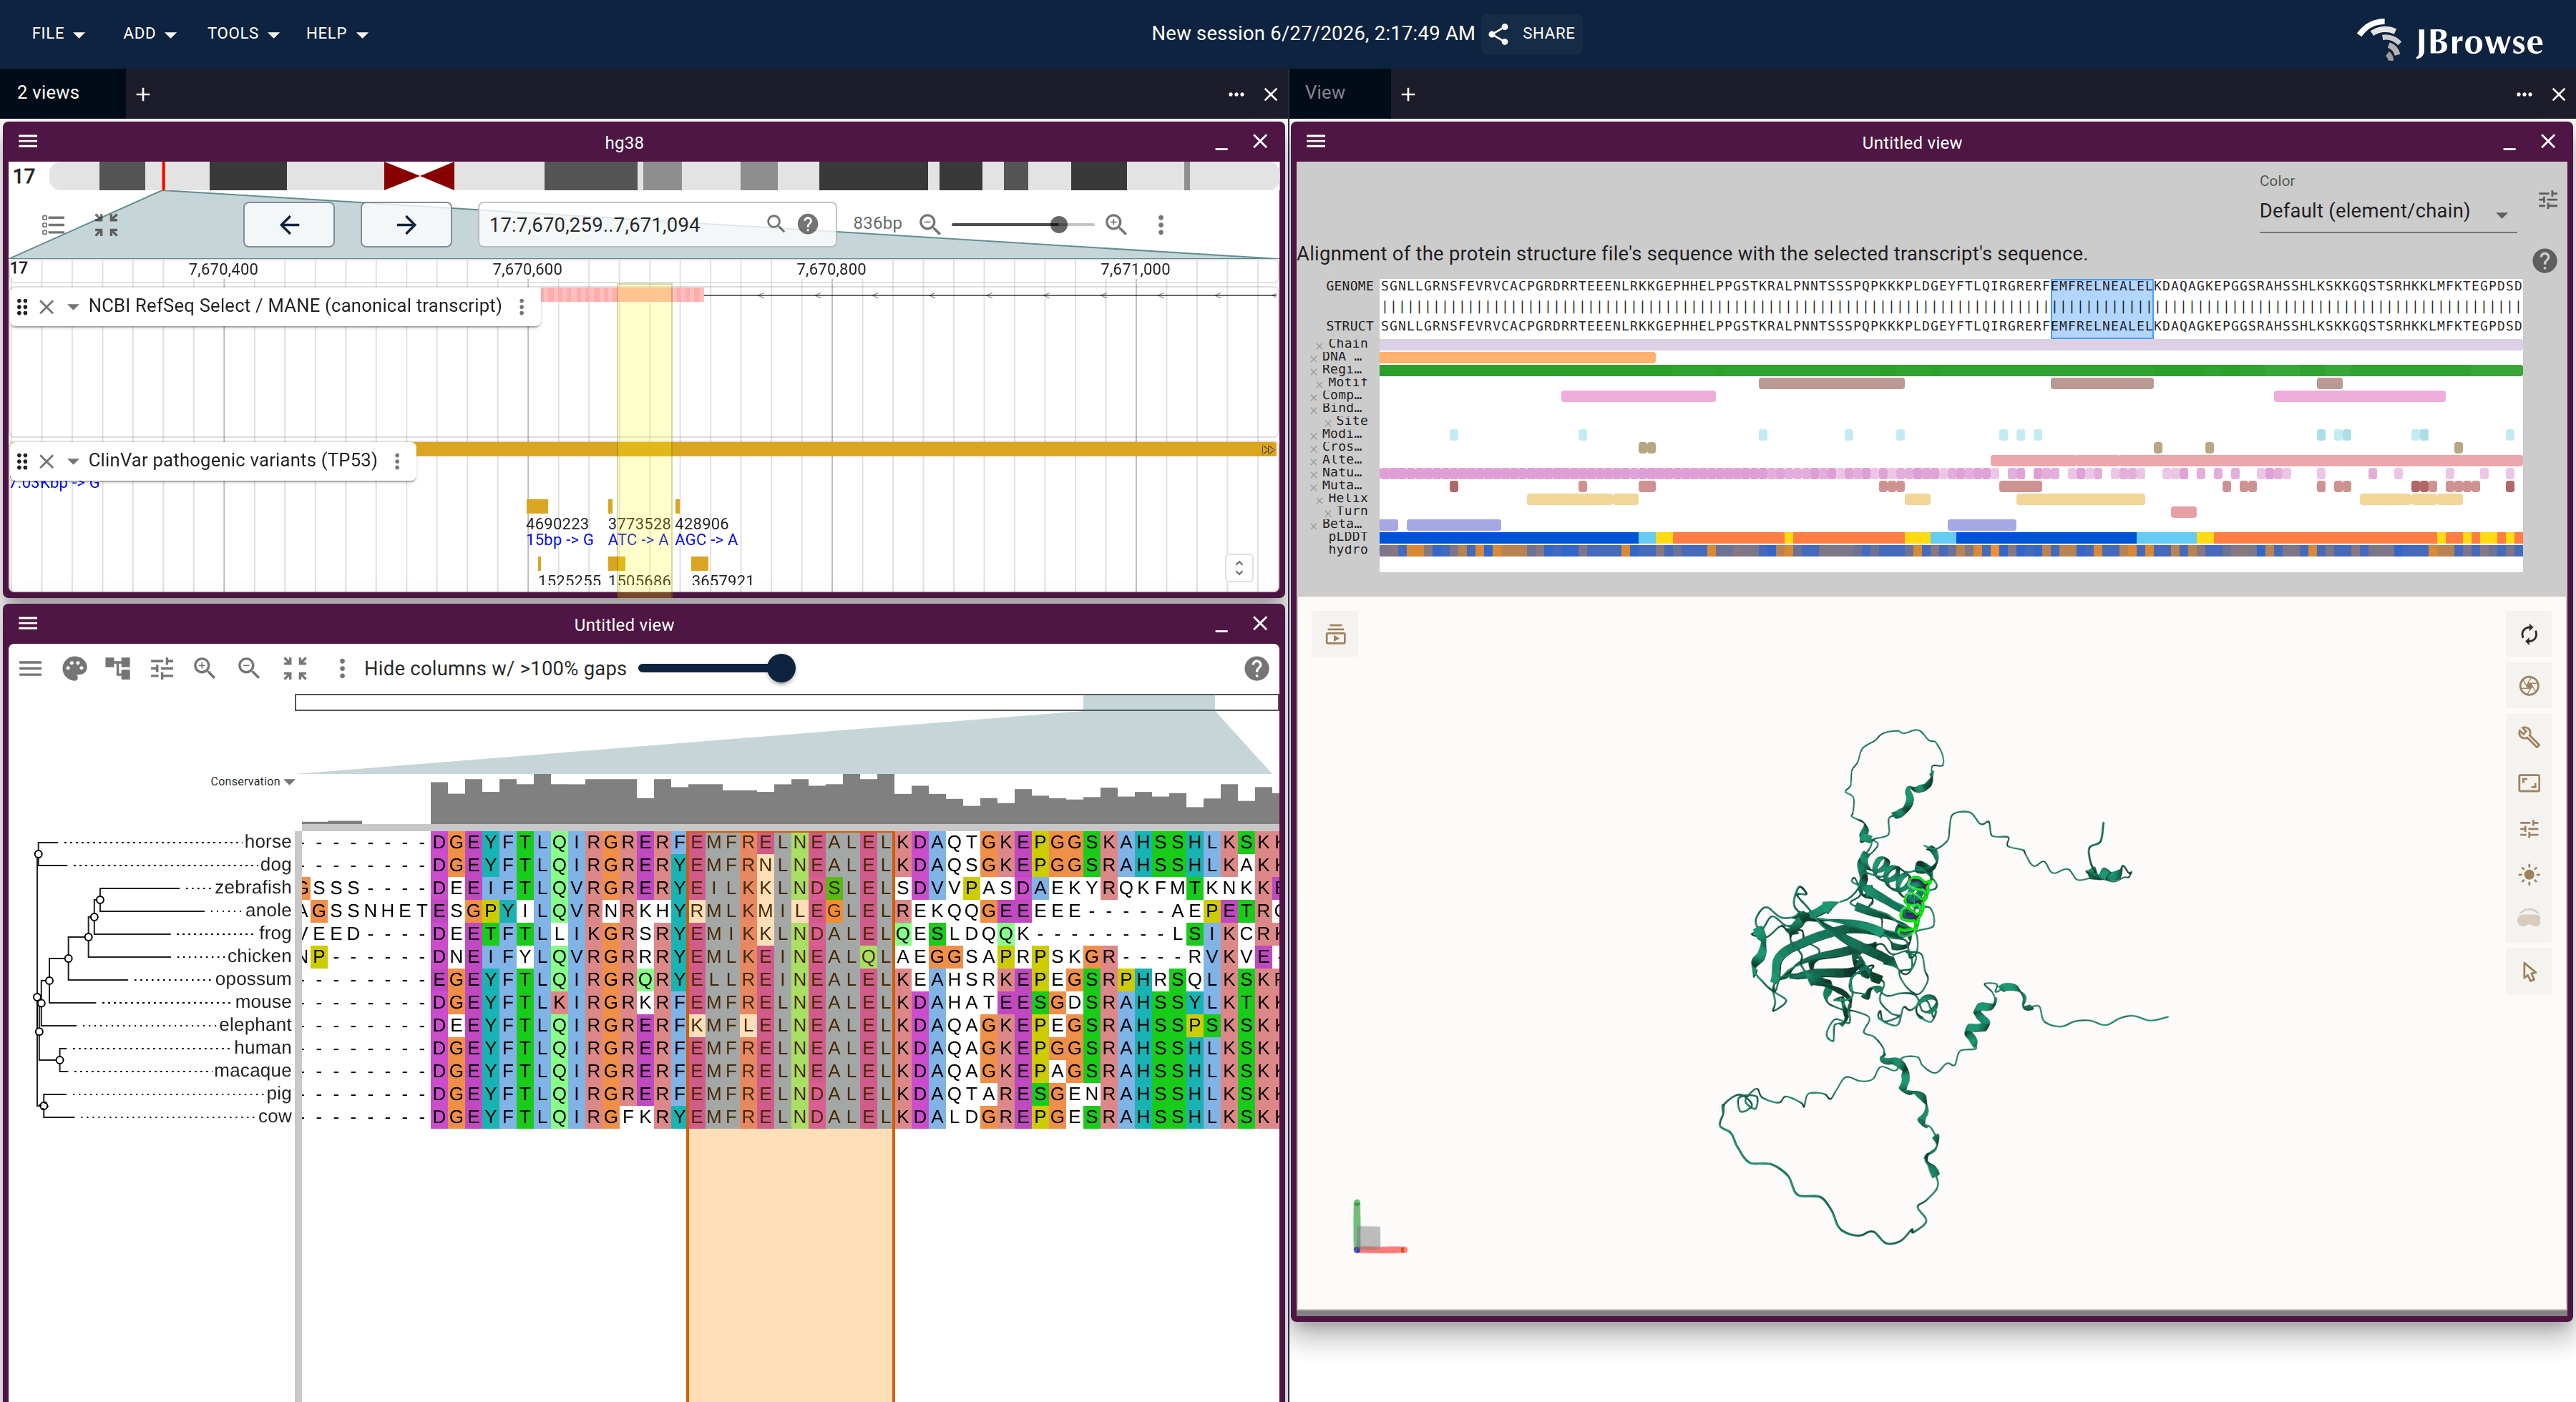
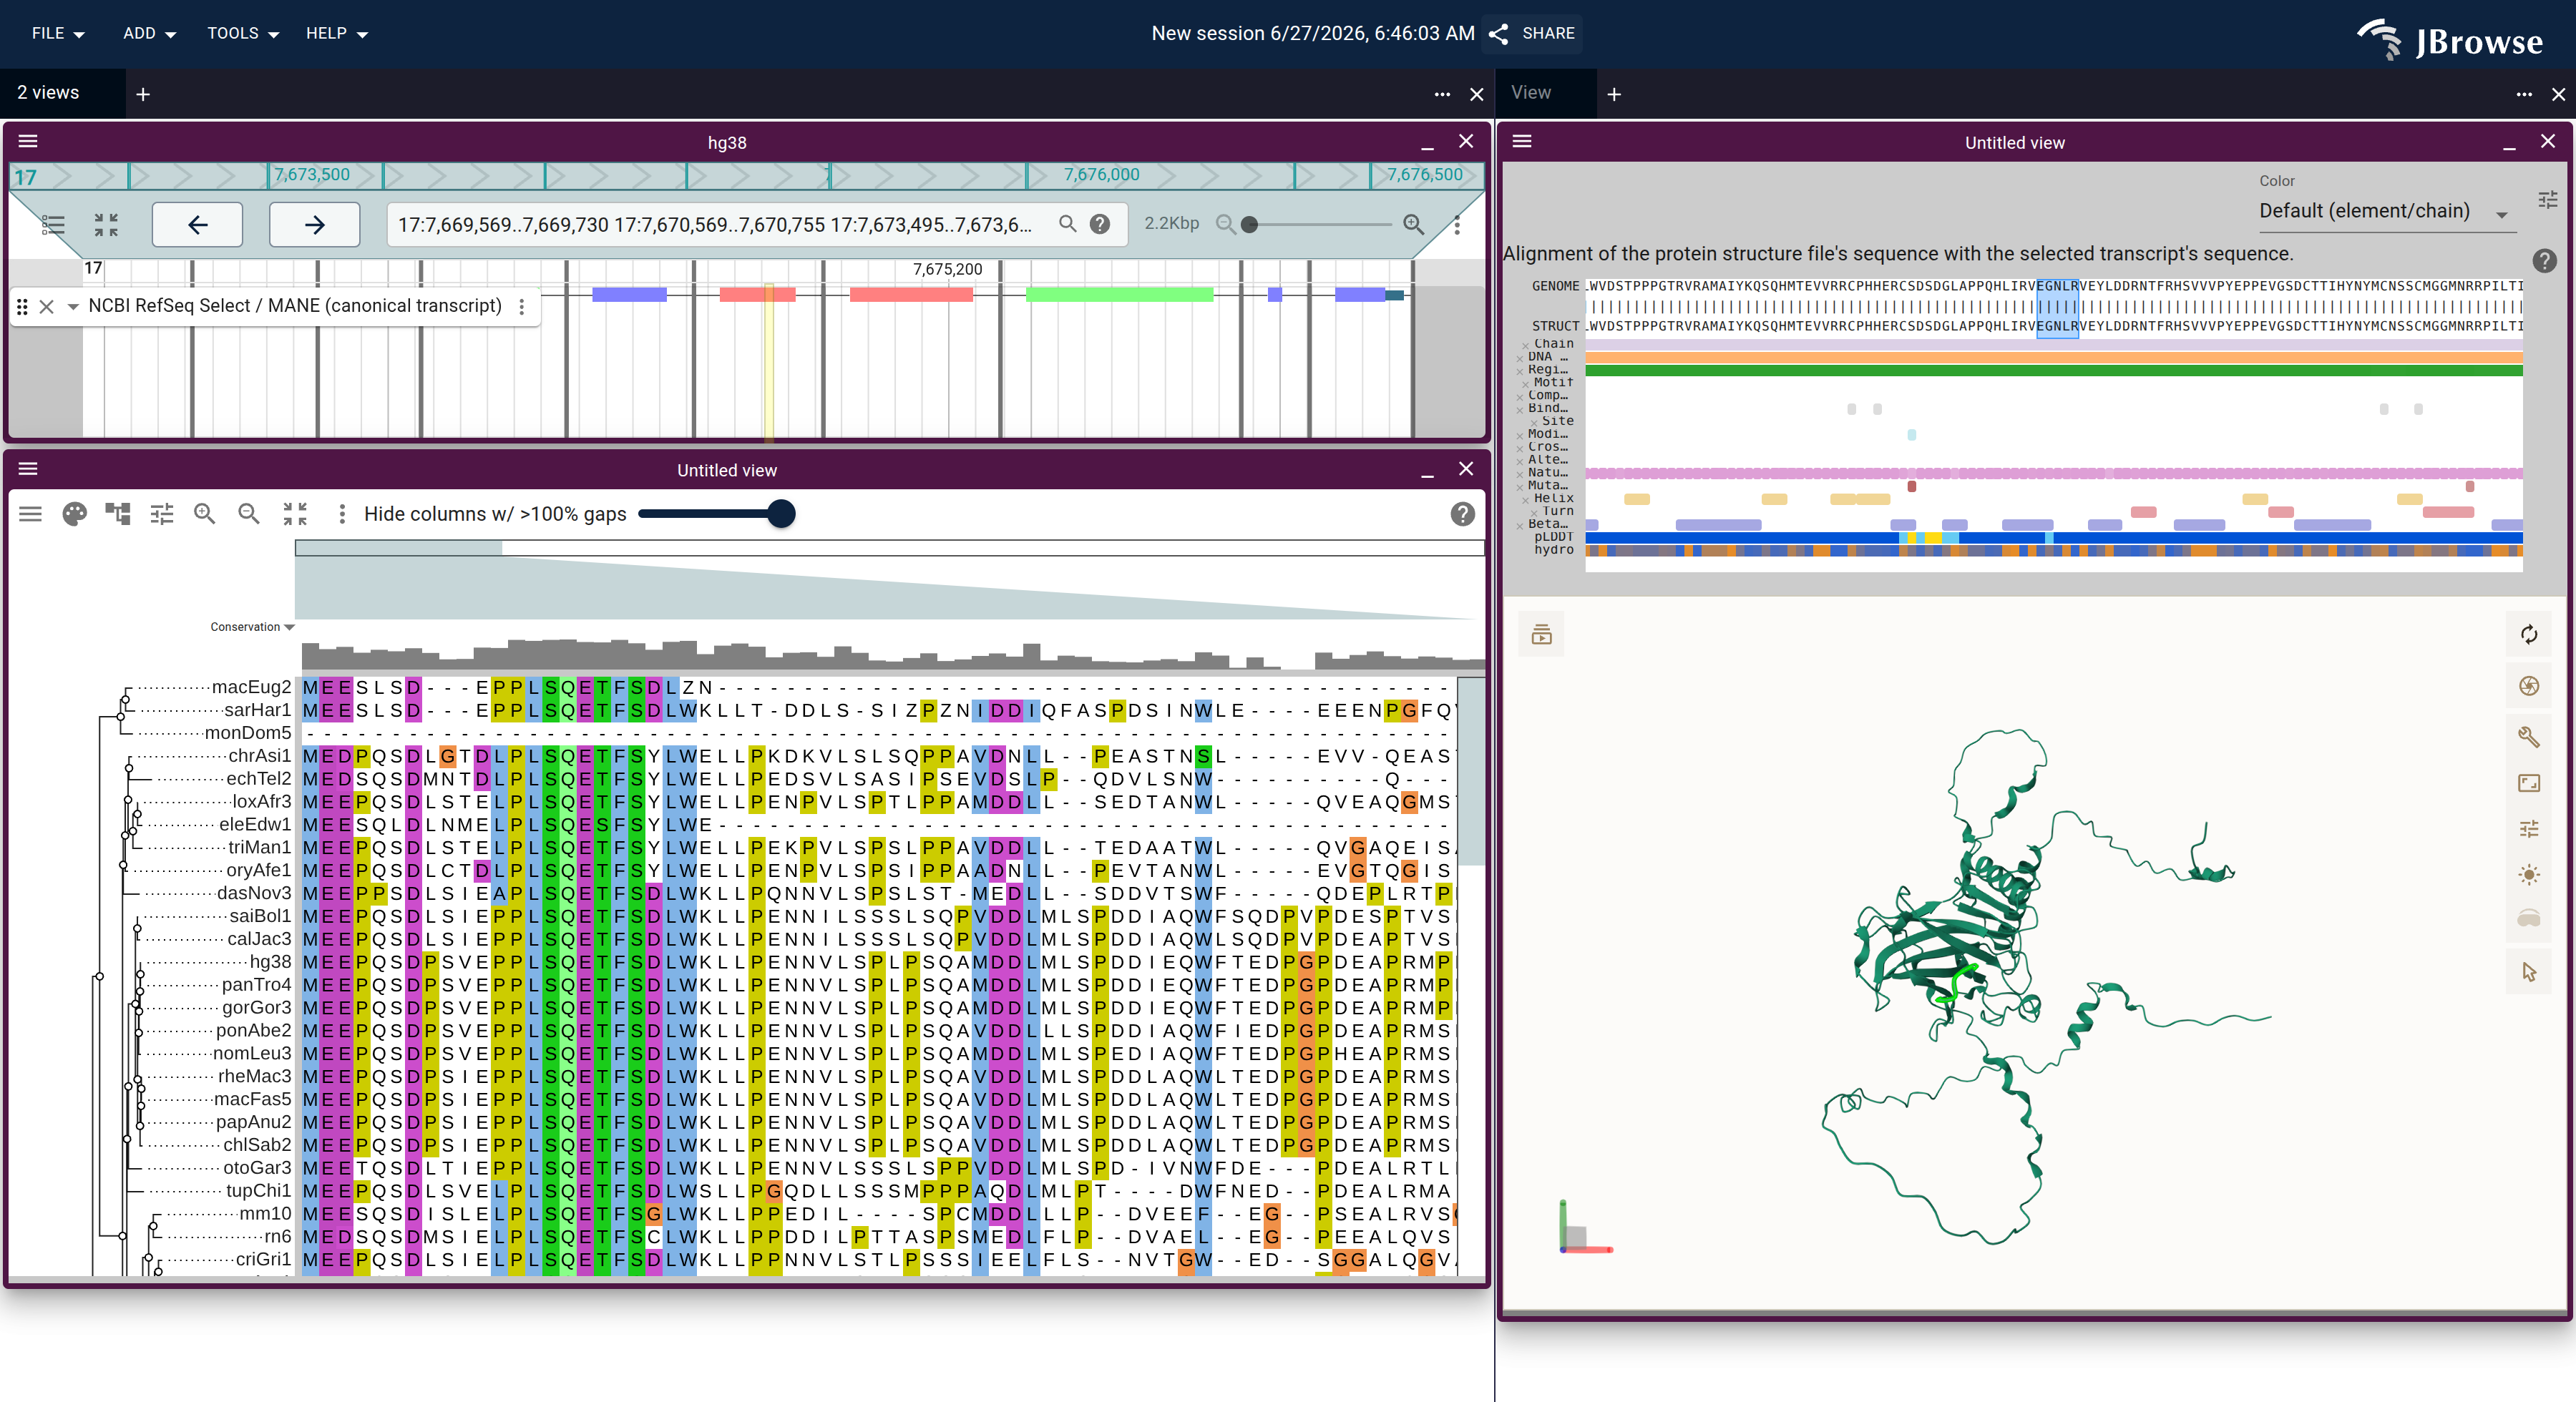
Genome ↔ alignment in one JBrowse session: the F12 locus (RefSeq annotation, top) over the react-msaview DNA alignment + species tree, zoomed to base resolution at exon 3. The highlighted column ties the genome to the alignment — the four cetaceans carry a single-base deletion (a gap where every other mammal has a C) that disables the gene. This is the viewer an MSA editor would build on: the 14-exon model is already registered to the alignment columns and lifted onto each species.Open in JBrowse ↗Genome ↔ alignment ↔ 3D structure: the TP53 gene (RefSeq + ClinVar), the p53 ortholog alignment, and the AlphaFold structure as one connected session, opened with the nuclear export signal motif (residues 339–350) lit across all three — the same motif highlighted on the genome, the alignment column, and the folded structure at once.Open in JBrowse ↗
Built on the fly by the
gene explorer for any gene (here a human
one): selecting a span of residues on the AlphaFold structure lights the exact
same codons on the collapsed-intron genome view (the yellow band) and the 100-way
alignment — structure ↔ genome ↔ alignment, codon-precise.
The same connected pattern without the structure view:
SRC ↗ — the Src-family
kinase alignment beside the SRC gene.
BRAF V600E ↗ — the RAF
family on the invariant V600 codon, with a ClinVar pathogenic-variant track.
TP53 R248 ↗ — p53 across
vertebrates on the R248 hotspot, with ClinVar.