GMOD
Chado Companalysis Module
The companalysis module is designed for the storage of computational sequence analysis. The key concept is that the results of a computational analysis can be interpreted or described as a sequence feature.
Contents
Using the companalysis module
The following are examples showing how to use this module to describe the results from a given computational analysis.
Alignment Results in Flybase
Written by Andy Schroeder, the original Wiki page is here: http://cedar.bio.indiana.edu/mediawiki/index.php/Aligned_computational_analyses_implementation.
Background
Alignment of nucleic acids and conceptually back translated proteins to the genomic chromosomal arms provides much of the evidence for gene model annotation. Several different algorithms have been employed to produce alignments of various types of features to the chromosomal arms. The aligned features and the corresponding alignments are implemented in chado in a similar manner for each of the analyses.
There also exists sets of data primarily derived from gene prediction algorithms in which non-localized alignment match features and their associated genome localized match features (analogous to hsp matches) are stored. These localized match features are only localized via featureloc to the genome and not to a second type of feature.
General implementation
Nucleotide and protein alignments
     ----------------------------------------------  genome
             ^                   ^
             |   _______A______  |          alignment feature type = match
        floc |    ^          ^   | floc (rank = 0)
             |    | f_r  f_r |   |
            --B----        ---C---        hsp feature type = match
                  |        |
             floc |        | floc (rank = 1)
                  V        V
                  ----D-----              aligned feature type = EST, cDNA, protein etc.
Predicted features
     ----------------------------------------------  genome
             ^                   ^
             |   _______A______  |          alignment feature type = match
        floc |    ^          ^   | floc (rank = 0)
             |    | f_r  f_r |   |
            --B----        ---C---        hsp feature type = match
Examples
See the diagrams above.
Feature A (uniquename = 4191059_sim4) is the alignment feature of type match.
- feature.is_analysis = ‘t’
- this is an abstract feature used to group and order HSP features
- feature A is linked to the HSP features B and C via a
feature_relationship with feature A as the object and features B and
C as subjects with the feature_relationship rank indicating ordering
of features
- note that the rank has not been implemented for many of the current alignments (sim4 and sim4tandem)
- this feature is linked to analysis via analysisfeature
Feature B (uniquename = 10425228) and feature C (uniquename = 10425229) are HSP features.
- feature.is_analysis = ‘t’
- the HSP features linked via feature_relationship as described above to explicitly represent ordering and grouping and are linked via a partof relationship type
- these features are located to the genome (srcfeature.id = arm) and this featureloc info has featureloc.rank = 0
- the HSPs are also linked to the specific analysis via
analysisfeature
- for aligned sequences these features are also located to the aligned feature (i.e. cDNA, EST etc.) and this featureloc info has a featureloc.rank = 1
- note that this only applies to aligned sequences and not gene predictions
Feature D (uniquename = CO056789) is the aligned feature i.e. cDNA, EST, protein.
- feature.is_analysis = ‘t’
- the aligned HSPs are located to this feature via featureloc with featureloc.rank = 1
- featureloc.residue_info should contain the residues of this feature
that correspond to the extent of the HSP
- note that the residue_info is specific to the type of feature that is aligned (for example if a protein is aligned to the genome via blastx then the featureloc.residue_info should be aminoacid residues)
Evidence data types in chado
Aligned features
Here is a list from ‘chado_dmel_r4_3_16a_reporting’ of aligned feature types and the algorithms used to align them (not filtered by species).
SQL query:
SELECT DISTINCT c.name as feature_type, a.program
FROM   feature alg, feature hsp, analysisfeature af, analysis a, cvterm c, featureloc fl
WHERE  hsp.feature_id = af.feature_id and af.analysis_id = a.analysis_id
and    hsp.feature_id = fl.feature_id and alg.feature_id = fl.srcfeature_id
and    fl.rank = 1 and c.cvterm_id = alg.type_id
ORDER BY program;

results:
   feature_type       |           program
----------------------+------------------------------
 so                   | assembly
 BAC                  | bdgp_unknown_clonelocator
 EST                  | blastn
 protein              | blastx_masked
 oligonucleotide      | dmel_r3_to_dmel_r4_migration
 protein              | prosplign
 RepeatMasker:dummy   | repeatmasker
 so                   | repeatmasker
 EST                  | sim4
 alignment            | sim4
 mRNA                 | sim4
 ncRNA                | sim4
 pseudogene           | sim4
 rRNA                 | sim4
 region               | sim4
 snRNA                | sim4
 snoRNA               | sim4
 so                   | sim4
 tRNA                 | sim4
 transposable_element | sim4
 cDNA                 | sim4tandem
 so                   | sim4tandem
 cDNA                 | splign
 protein              | tblastn
 EST                  | tblastx_masked
 so                   | tblastx_masked
 DNA                  | tblastxwrap_masked
 so                   | tblastxwrap_masked
(28 rows)
Predicted features
Note that this was determined by a process of elimination from the results of the following query:
SELECT DISTINCT c.name, a.program
  FROM feature map_feat, feature hsp, analysisfeature af,
       analysis a, cvterm c, feature_relationship fr
 WHERE hsp.feature_id = af.feature_id and af.analysis_id = a.analysis_id
   and hsp.feature_id = fr.subject_id  and map_feat.feature_id = fr.object_id
   and c.cvterm_id = map_feat.type_id ORDER BY program;

and then removing those matches that corresponded to the alignment features for the
part A query

      name       |           program
-----------------+------------------------------
 match           | augustus
 match           | genewise
 match           | genie_masked
 match           | genscan
 match           | genscan_masked
 match           | promoter
 match           | repeat_runner_seg
 match           | tRNAscan-SE
 syntenic_region | tblastn
 match           | twinscan
Tables
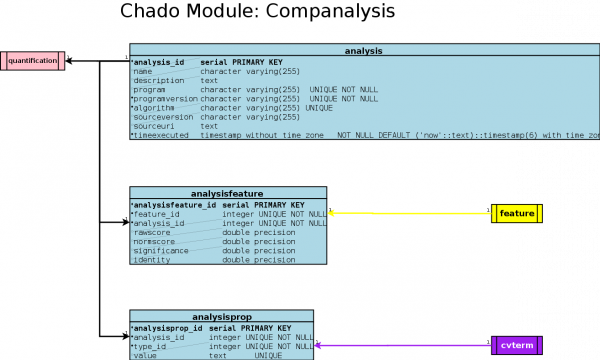
Table: analysis
An analysis is a particular type of a computational analysis; it may be a blast of one sequence against another, or an all by all blast, or a different kind of analysis altogether. It is a single unit of computation.
| F-Key | Name | Type | Description |
|---|---|---|---|
| analysis_id | serial | PRIMARY KEY | |
| name | character varying(255) | A way of grouping analyses. This should be a handy short identifier that can help people find an analysis they want. For instance "tRNAscan", "cDNA", "FlyPep", "SwissProt", and it should not be assumed to be unique. For instance, there may be lots of separate analyses done against a cDNA database. |
|
| description | text | ||
| program | character varying(255) | UNIQUE#1 NOT NULL Program name, e.g. blastx, blastp, sim4, genscan. |
|
| programversion | character varying(255) | UNIQUE#1 NOT NULL Version description, e.g. TBLASTX 2.0MP-WashU [09-Nov-2000]. |
|
| algorithm | character varying(255) | Algorithm name, e.g. blast. |
|
| sourcename | character varying(255) | UNIQUE#1 Source name, e.g. cDNA, SwissProt. |
|
| sourceversion | character varying(255) | ||
| sourceuri | text | This is an optional, permanent URL or URI for the source of the analysis. The idea is that someone could recreate the analysis directly by going to this URI and fetching the source data (e.g. the blast database, or the training model). |
|
| timeexecuted | timestamp without time zone | NOT NULL DEFAULT ('now'::text)::timestamp(6) with time zone |
analysis Structure
Tables referencing this one via Foreign Key Constraints:
Table: analysisfeature
Computational analyses generate features (e.g. Genscan generates transcripts and exons; sim4 alignments generate similarity/match features). analysisfeatures are stored using the feature table from the sequence module. The analysisfeature table is used to decorate these features, with analysis specific attributes. A feature is an analysisfeature if and only if there is a corresponding entry in the analysisfeature table. analysisfeatures will have two or more featureloc entries, with rank indicating query/subject
| F-Key | Name | Type | Description |
|---|---|---|---|
| analysisfeature_id | serial | PRIMARY KEY | |
| feature_id | integer | UNIQUE#1 NOT NULL | |
| analysis_id | integer | UNIQUE#1 NOT NULL | |
| rawscore | double precision | This is the native score generated by the program; for example, the bitscore generated by blast, sim4 or genscan scores. One should not assume that high is necessarily better than low. |
|
| normscore | double precision | This is the rawscore but semi-normalized. Complete normalization to allow comparison of features generated by different programs would be nice but too difficult. Instead the normalization should strive to enforce the following semantics: * normscores are floating point numbers >= 0, * high normscores are better than low one. For most programs, it would be sufficient to make the normscore the same as this rawscore, providing these semantics are satisfied. |
|
| significance | double precision | This is some kind of expectation or probability metric, representing the probability that the analysis would appear randomly given the model. As such, any program or person querying this table can assume the following semantics: * 0 <= significance <= n, where n is a positive number, theoretically unbounded but unlikely to be more than 10 * low numbers are better than high numbers. |
|
| identity | double precision | Percent identity between the locations compared. Note that these 4 metrics do not cover the full range of scores possible; it would be undesirable to list every score possible, as this should be kept extensible. instead, for non-standard scores, use the analysisprop table. |
analysisfeature Structure
Table: analysisprop
| F-Key | Name | Type | Description |
|---|---|---|---|
| analysisprop_id | serial | PRIMARY KEY | |
| analysis | analysis_id | integer | UNIQUE#1 NOT NULL |
| cvterm | type_id | integer | UNIQUE#1 NOT NULL |
| value | text | UNIQUE#1 |
analysisprop Structure
UML diagram