Galaxy Tutorial 2012
This walks you through setting up and running a Galaxy server. This tutorial was originally taught by Dave Clements at the 2012 GMOD Summer School.
Contents
- 1 Some General Galaxy Resources
- 2 Create a Galaxy instance
- 3 Running analyses with Galaxy
- 4 Visualization in Galaxy
- 5 Second Peek at the Plumbing
- 6 Sharing, Publishing, and Reusing
- 7 Galaxy CloudMan
- 8 Where to go next
Galaxy is a data integration and analysis framework for biomedical research. Galaxy allows nearly any tool that can be run from the command line to be integrated into it.
On top of these tools, Galaxy provides an accessible environment for interactive analysis that transparently tracks the details of analyses, a workflow system for convenient reuse, data management, sharing, publishing, and more.
Some General Galaxy Resources
Before we get started, let's highlight some Galaxy resources that may be useful to us along the way.
- http://galaxyproject.org
- The Galaxy Project home page
- GalaxyWiki
- All things Galaxy.
- http://usegalaxy.org/
- The Galaxy project's free public server.
- Galaxy Search
- Integrated searches of all online Galaxy resources. Available searches:
- Pan-Galactic Web Search
- Search everything
- Galaxy Mailing Lists Search
- Search the (Nabble-powered) mailing list archives
- Using Galaxy Search
- Search online resources related to using Galaxy
- Galaxy Admin and Development Search
- Search online resources related to deploying and developing Galaxy
- All: give me everything
- Tools: show me doc on tools related to my search.
- Email: show email threads related to my search.
- Source code: show Galaxy source code related to my search
- Shared: Show published Galaxy objects related to my search
- Documentation: Show documentation (e.g. wiki pages, tool doc, ...) related to my search.
- Abstracts: Show papers related to my search.
- Requests: Should feature requests related to my search.
This is all implemented using Google Custom Search.
- Public Galaxy Servers
- Current list of know publicly accessible Galaxy servers.
- Mailing Lists and Mailing Lists Search
- Galaxy has several mailing lists, some of which are very active
- Screencasts, lots of them.
- Slides, and sometimes videos, from past Galaxy-related events and presentations.
- Galaxy CiteULike group (@ CiteULike) and Mendeley mirror
- Eight different tags/categories.
Create a Galaxy instance
Prerequisites
The only prerequisite to run your own Galaxy is a Python interpreter, version 2.5 or greater. Python 3 is a different language and is currently not supported. The GMOD Amazon Machine Image (AMI) used for this course includes version 2.6.5 of the interpreter.
$ python --version
Python 2.6.5
Galaxy is distributed (and developed) using a distributed version control system called Mercurial. The AMI already includes mercurial version 1.4.3:
$ hg --version
Mercurial Distributed SCM (version 1.4.3)
...
Clone the Galaxy repository
The development and release repositories are available through the bitbucket hosting service.
DO NOT DO THIS NOW as it has already been done on your image:
To create a local clone of the release repository run the following:
 $ cd ~/Galaxy
 $ hg clone http://bitbucket.org/galaxy/galaxy-dist
Take Advantage of the GMOD in the Cloud Directory Structure
All of the Galaxy files are currently in the ~ubuntu home directory under Galaxy. Let's start by moving this to the non-volatile disk, so to speak, on the GMOD in the Cloud-based AWS image we are using.
$ cd
$ mv Galaxy /data/dataHome/
$ ln -s /data/dataHome/Galaxy Galaxy
Update Galaxy Configuration File
Often you can just fire up Galaxy at this point. However, we want a few things to be different from the default installation. Galaxy's main configuration file is universe_wsgi.ini. By default, that file is created at initialization time by copying universe_wsgi.ini.sample. However, if the file already exists it is not copied over. Copy the file and update it:
$ cd ~/Galaxy/galaxy-dist
$ cp universe_wsgi.ini.sample universe_wsgi.ini
$ pico universe_wsgi.ini
Change the port from
#port = 8080
to this:
port = 8081
Galaxy, like WebApollo and several other components that were also covered at the course, will listen to port 8080 by default; for simplicity, we will configure Galaxy to listen to a different port.
Change the host from
#host = 127.0.0.1
to:
host = 0.0.0.0
This makes Galaxy visible to remote hosts, such as your laptop
Set the brand to make it obvious that you are working on your Galaxy instance
Change this:
#brand = None
to this:
brand = My Super Cool Brand
Use a more robust database
Out of the box Galaxy includes the embedded SQLite database. This allows Galaxy to run with zero-configuration and provides an excellent solution for single-user Galaxy installations being used for tool development. However, for any multi-user scenario a more robust database will be needed for Galaxy to be reliable. We highly recommend Postgres, although other databases are known to work. Postgres is already installed on our AMI (it's the default DBMS for Chado)
Update universe_wsgi.ini file to use Postgres. Update the Database section of your Galaxy config file to look like:
# -- Database
# By default, Galaxy uses a SQLite database at 'database/universe.sqlite'.  You
# may use a SQLAlchemy connection string to specify an external database
# instead.  This string takes many options which are explained in detail in the
# config file documentation.
#database_connection = sqlite:///./database/universe.sqlite?isolation_level=IMMEDIATE
database_connection = postgres://ubuntu:@localhost:5432/galaxydb
# If the server logs errors about not having enough database pool connections,
# you will want to increase these values, or consider running more Galaxy
# processes.
#database_engine_option_pool_size = 5
#database_engine_option_max_overflow = 10
# If using MySQL and the server logs the error "MySQL server has gone away",
# you will want to set this to some positive value (7200 should work).
#database_engine_option_pool_recycle = -1
# If large database query results are causing memory or response time issues in
# the Galaxy process, leave the result on the server instead.  This option is
# only available for PostgreSQL and is highly recommended.
database_engine_option_server_side_cursors = True
# Create only one connection to the database per thread, to reduce the
# connection overhead.  Recommended when not using SQLite:
database_engine_option_strategy = threadlocal
# Log all database transactions, can be useful for debugging and performance
# profiling.  Logging is done via Python's 'logging' module under the qualname
# 'galaxy.model.orm.logging_connection_proxy'
#database_query_profiling_proxy = False
Save the file.
The ubuntu user has permission to create databases, so let's create the database that we told Galaxy to connect to:
$ createdb galaxydb
Run, Galaxy, Run!
Galaxy includes a script to run it. This script also performs the Galaxy initialization the first time it is run. Run it now:
$ sh run.sh --reload
Initializing community_wsgi.ini from community_wsgi.ini.sample
Initializing datatypes_conf.xml from datatypes_conf.xml.sample
Initializing external_service_types_conf.xml from external_service_types_conf.xml.sample
Initializing migrated_tools_conf.xml from migrated_tools_conf.xml.sample
Initializing reports_wsgi.ini from reports_wsgi.ini.sample
Initializing shed_tool_conf.xml from shed_tool_conf.xml.sample
... (a minute or two or three will pass) ...
galaxy.web.buildapp DEBUG 2012-08-15 07:08:36,756 Enabling 'x-forwarded-host' middleware
Starting server in PID 1408.
Serving on 0.0.0.0:8081 view at http://127.0.0.1:8081
This script performs several significant actions the first time it is run:
- Creates initial configuration files, including the main file universe_wsgi.ini, and empty directories for storing data files
- Fetches all of the Galaxy framework's dependencies, packaged as Python eggs, for the current platform.
- Initializes its database. Galaxy uses a database migration system to automatically handle any changes to the database schema. On first load it runs all migrations to ensure the database is in a known state, which may take a little time.
Once the database is initialized, the normal startup process proceeds, loading tool configurations, starting the job runner, and finally initializing the web interface on the requested port. You can now access your Galaxy at http://ec2-##-##-##-##.compute-1.amazonaws.com:8081.
Running analyses with Galaxy
Without any additional configuration, there is already a lot we can do with our first Galaxy instance. As an example, let's work through an analysis that is based on, but distinct from the Galaxy 101 tutorial.
1. Access your new Galaxy instance
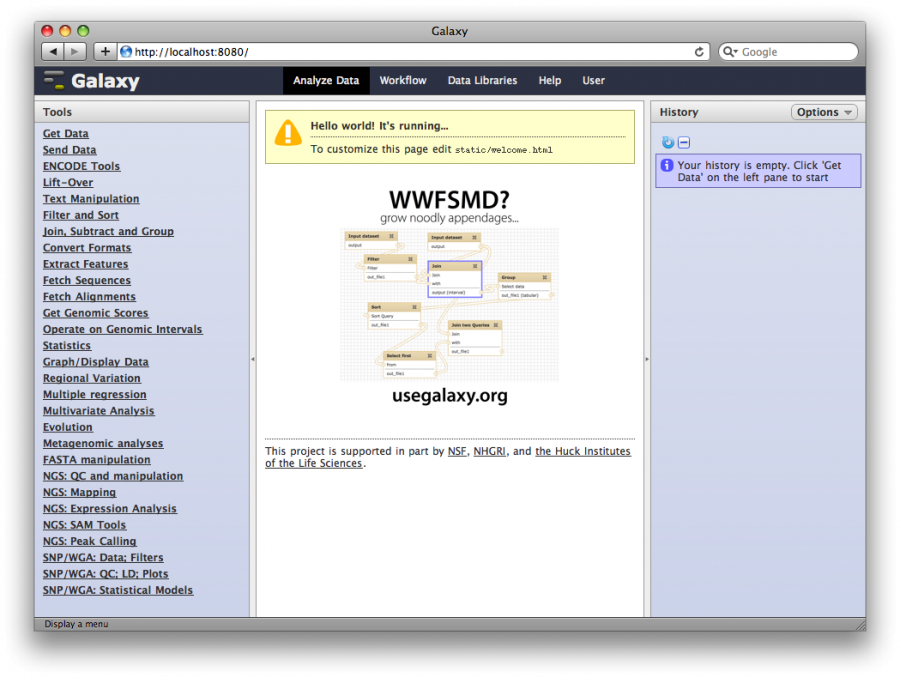
Start a web browser and access http://ec2-##-##-##-##.compute-1.amazonaws.com:8081.
Now that Galaxy is up and running, let's use it to answer the question:
Which coding exons have the highest number of embedded/overlapping repeats?
We will ask this question about pig chromosome 18 in our example.
2. Create a user
In the top bar, select User → Register. Enter your
- Email address
- Password
- Public name: Public names must be at least four characters in length and contain only lower-case letters, numbers, and the '-' character.
and click Submit.
Registering is not required in order to use Galaxy. However, to use all of it, users need to register.
2. Get Pig Exons
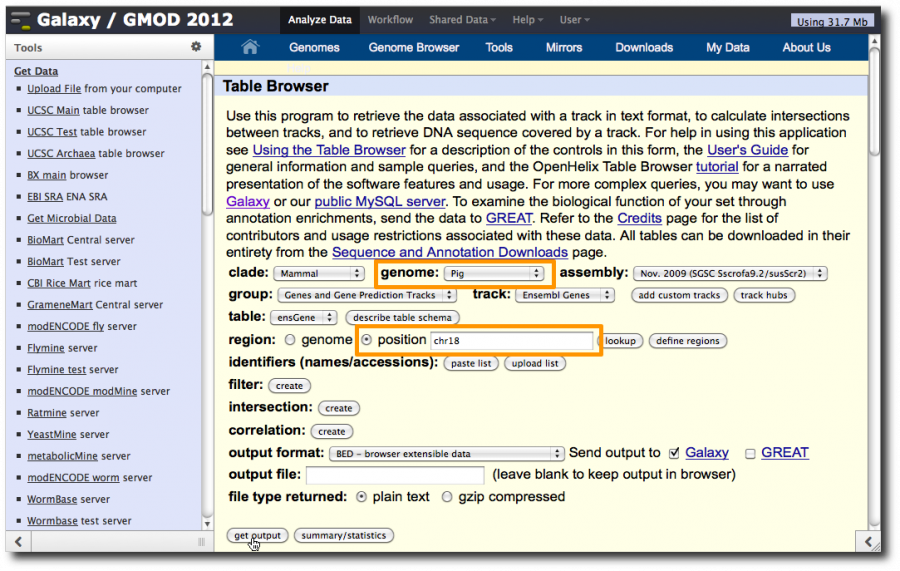
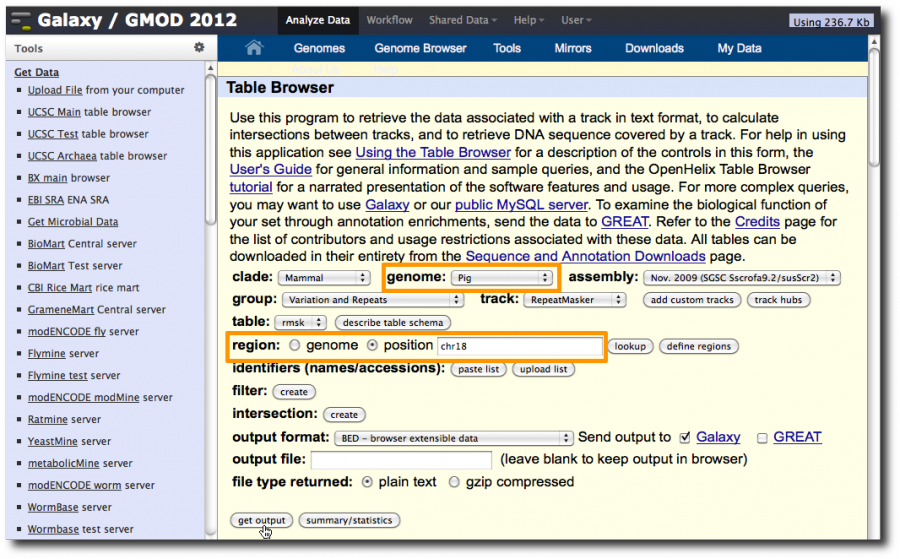
Select Tools → Get Data → UCSC Main. This will display the UCSC Table Browser, a web interface to the databases that back the UCSC genome browser. In this window, set
- genome: Pig
- region: check position and enter chr18
Click get output.
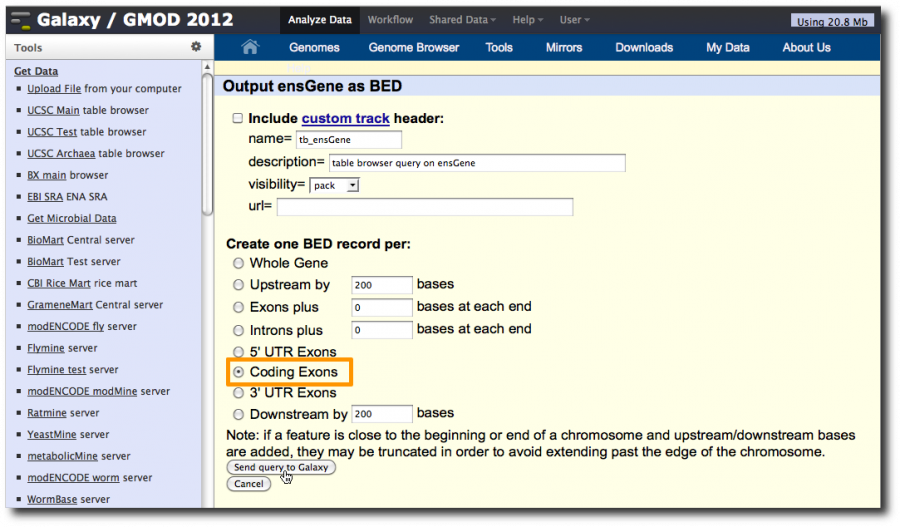
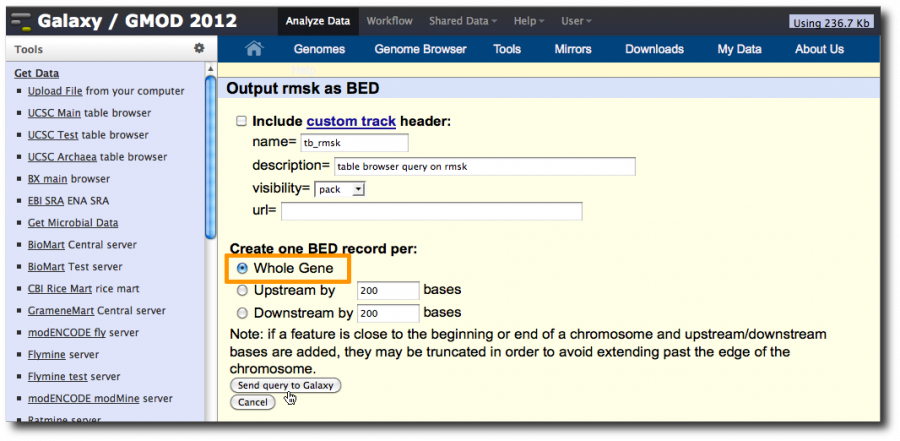
On the second UCSC page, click Coding Exons and then click Send query to Galaxy
Let's take a look at the data.
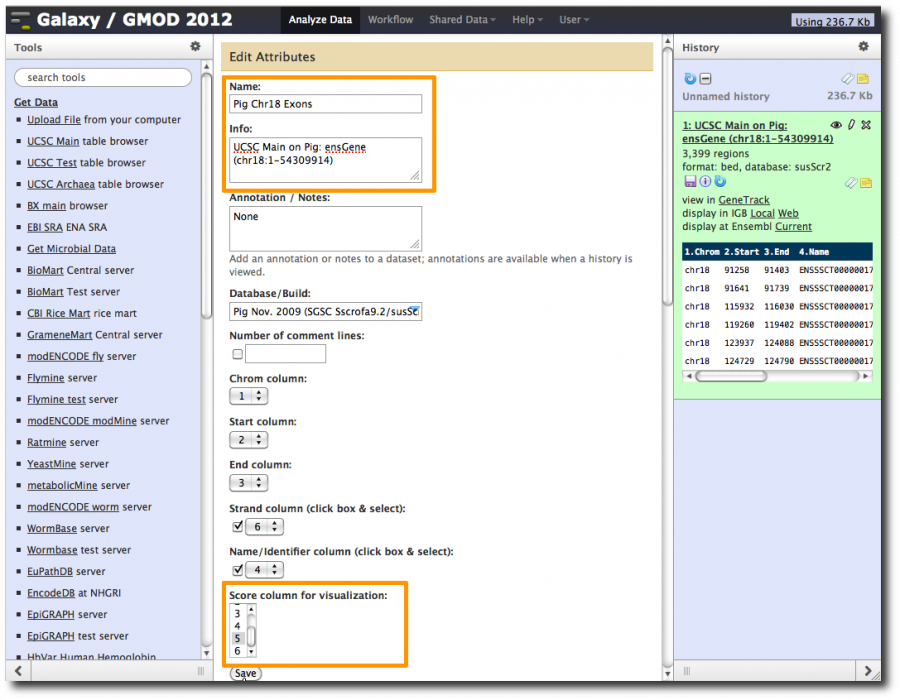
- Click on the dataset name for a preview.
- Poke the eye to see the full dataset.
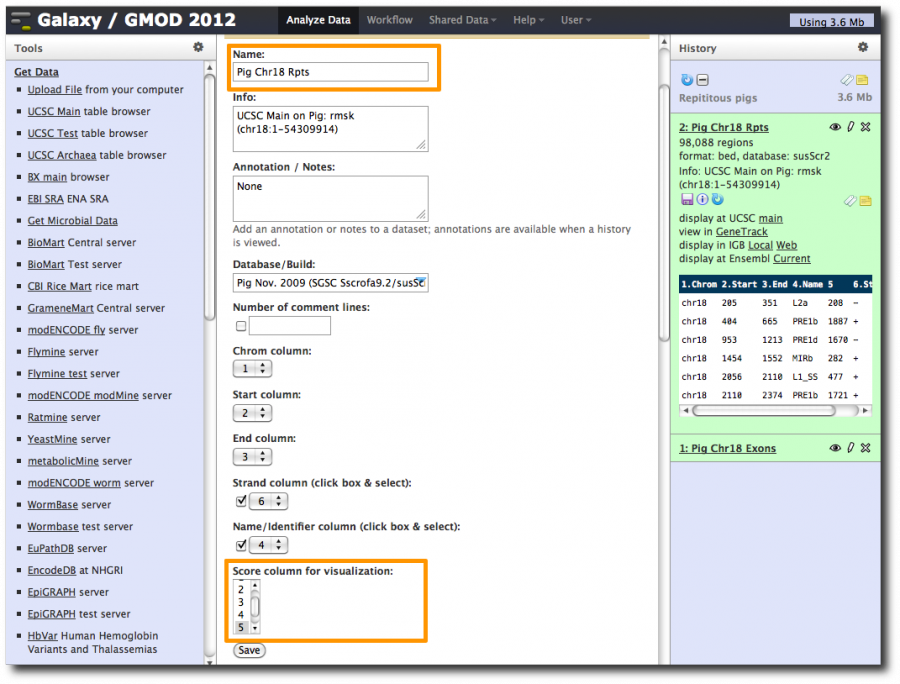
- Click on pencil icon and give dataset a better name (like Pig chr18 Exons) and set the score column to column 5. Click Save.
- Change the history name from unnamed history (which is true, but not useful) to something more meaningful.
That's odd
- I know Galaxy can send datasets to UCSC for visualization.
- But UCSC is not in the list of visualization options, even though we just got the data from UCSC.
- That's odd
Our first peek at the Plumbing
Galaxy-dist has several important subdirectories
| Path | Description |
|---|---|
| tools/ | Defines tools in Galaxy. |
| tool-data/ | Home of .loc files for sets of tools. .loc files tell where reference genomes, indexes, and the like can be found for particular tools. |
| • shared/ | Contains subdirectories for ensembl, gbrowse, genetrack, igv, jars, ncbi, rviewer, ucsc |
| • • ucsc/ | |
| • • • ucsc_build_sites.txt | Defines which genomes can be viewed at the various UCSC sites. |
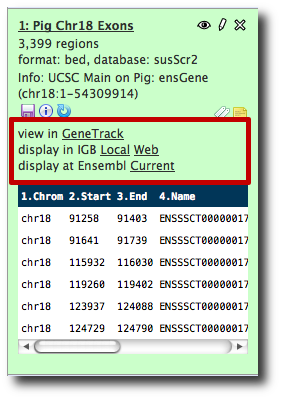
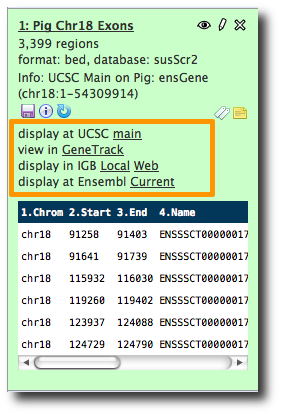
susScr2 is not in the list for the main UCSC site. Edit tool-data/shared/ucsc/ucsc_build_sites.txt and add it.
Restart Galaxy:
<control-c>
$ sh run.sh --reload
Click the Analyze Data tab to reload the screen. display at UCSC main is now one of the options.
3. Get Pig Repeat Regions
Get repeats from UCSC as well. Select Tools → Get Data → UCSC Main.
Set
- group: Variation and Repeats
- region: position and enter chr18
In the second UCSC window make sure Whole Gene is selected and then send the dataset to Galaxy.
Click on the new dataset's pencil icon and rename the dataset to something more useful, such as Pig Chr18 Rpts. Also set the score column to column 5.
Note that the dataset is already viewable in UCSC.
4. Identify genes and repeats that overlap
Select Tools → Operate on Genomic Intervals → Join.
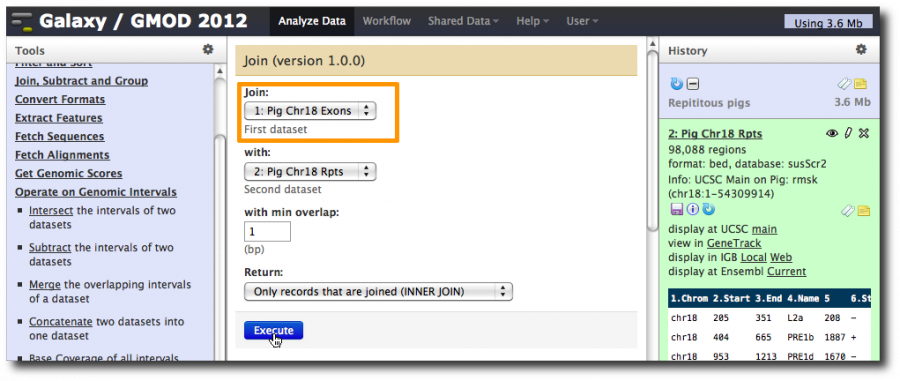
Join dataset 1 (exons) with dataset 2 (repeats), with min overlap of 1 bp. Return Only records that are joined (INNER JOIN).
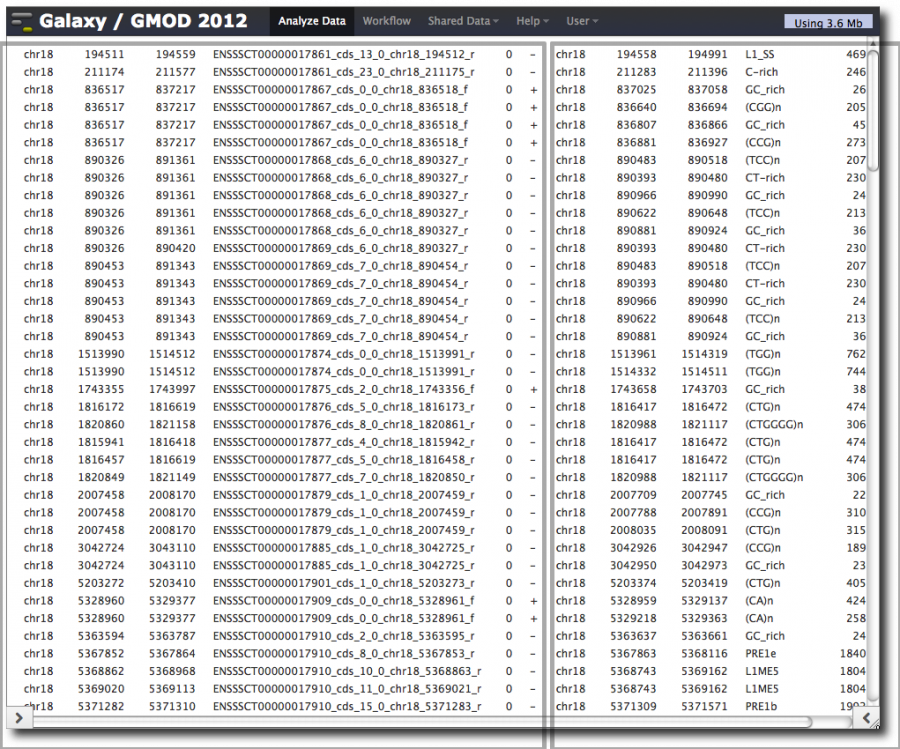
Takes two 6 column bed files and joins them together into 12 column records where the first 6 columns are from the exons dataset and the last 6 columns are from the repeats dataset. Furthermore, it only create records when a gene and a repeat overlap.
Take a close look at the dataset. Note that
- Some exons were dropped
- Some repeats were dropped
- Some exons occur multiple times
Make sure you understand why.
Finally, rename the dataset something like Exon Rpt Pairings
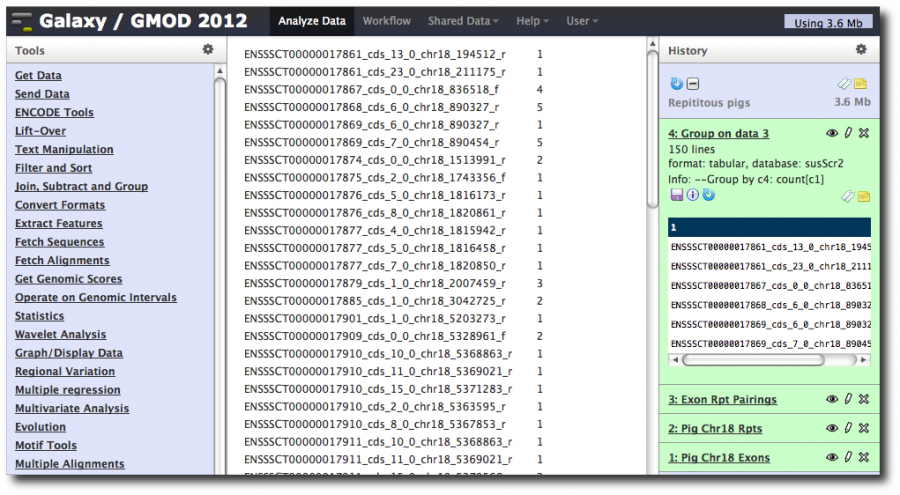
5. Group and Count
Now we want to walk through the exon-repeat pairings and count the number of times each exon occurs. This number is the number of repeats that overlap with each exon.
We are going to do another operation that is borrowed from relational databases. Select Tools → Join, Subtract, and Group → Group.
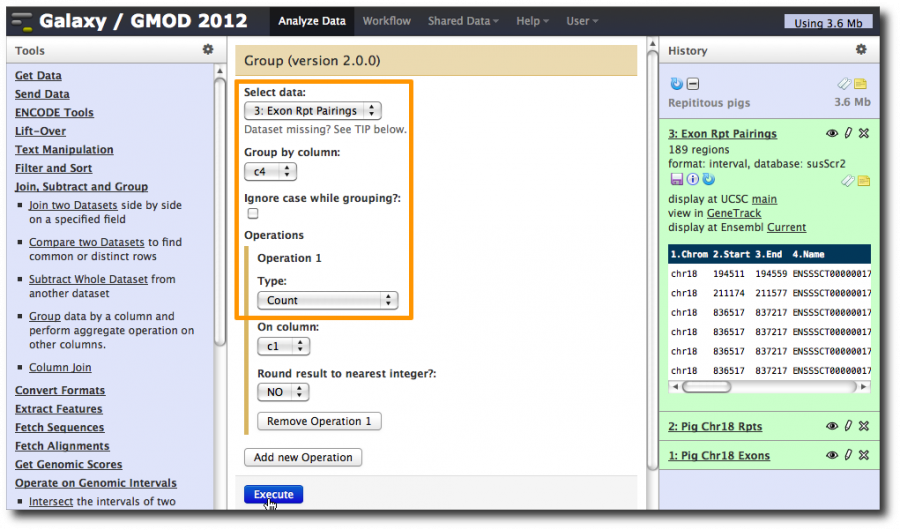
Select the exon-repeat pairings dataset and set Group by column to c4, the column in the dataset that contains the exon name.
Then click Add new operation and then set Type to Count.
This tells Galaxy to walk through the dataset, create a group for each different value of column 4 (the exon name), and then count the number of records that were in that group (i.e. the number of records that had each exon name).
This produces a two column dataset:
The first column is the value of the column we grouped by. The second is the number of records in the dataset that have that exon name.
Rename this dataset to Exons with rpt counts, unsorted.
If we were to now to run Tools → Filter and Sort → Sort on this dataset, we would have the answer to our original question:
Which exons have the most repeats?
We have the list of exons, and the counts in them. We could use this dataset in further analysis, email it someone, etc..
6. Get Exon Info back
However, we can do better. We have lost some information about the exons (like position, strand, and so on) that we had in the original exon dataset. If we can reclaim that information, and add to it, we can produce a more useful dataset that we can visualize right now.
The original exon dataset downloaded from UCSC had a meaningless score column. Let's replace that with the repeat count.
First, bring the original exon information together with the counts.
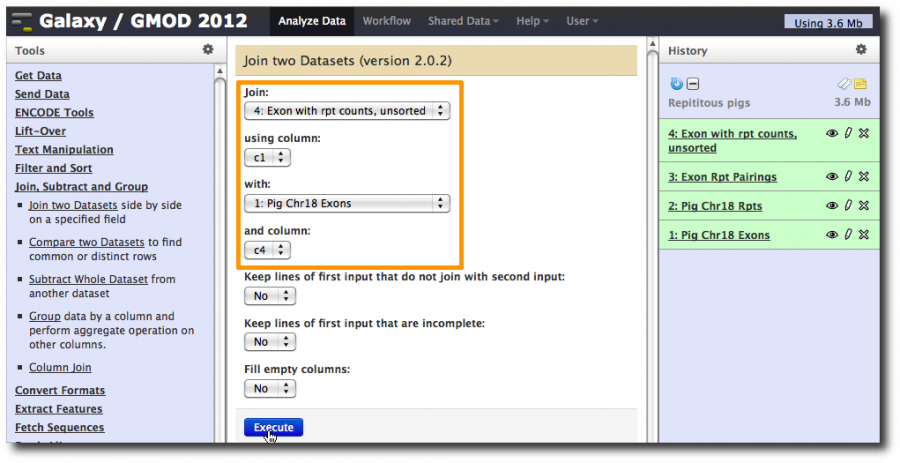
Select Tools → Join, Subtract and Group → Join two Datasets. Set the first dataset to Exons with repeat counts and the second to be the Pig Chr18 Exons dataset.
Join them using column c1 and column c4, which are the exon names in both datasets.
This produces and 8 column dataset with the exon repeat counts in the first two columns and the exon information in the last 6 columns.
Now, use the Cut tool to reshuffle these 8 columns into a valid 6 column BED file with the repeat count in column 5, the score column.
Select Tools → Text Manipulation → Cut. Enter c3,c4,c5,c6,c2,c8 in the Cut columns: box.
This takes 5 of the 6 columns from the exon dataset and drops the repeat count into the score column.
Rename the dataset to something more useful like Exons with Rpt Count as Score.
7. Set Datatype
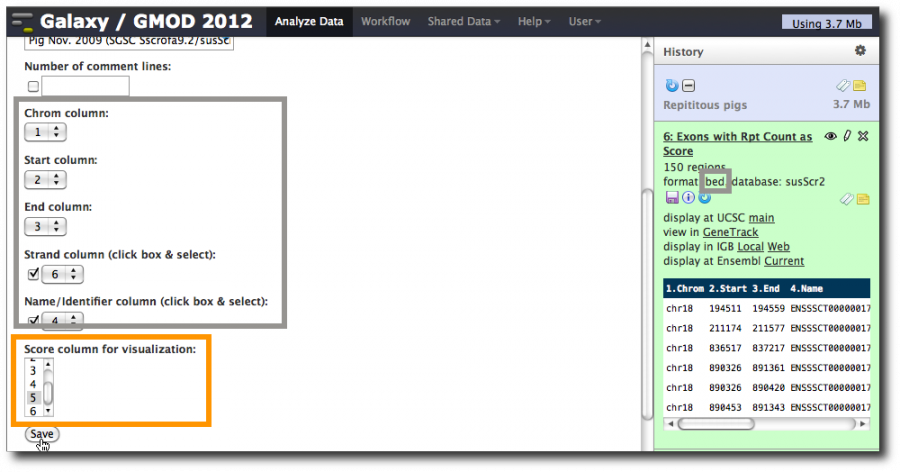
We now have a valid 6 column BED file, but Galaxy no longer knows that. Tell it.
Click the pencil icon, and scroll down to the Change data type section. Enter bed and click Save.
The updated information about the dataset is displayed. Note that column assignments have been made, and that the guesses are again correct, except for the score column. Set it to 5 and click Save.
8. Visualize it
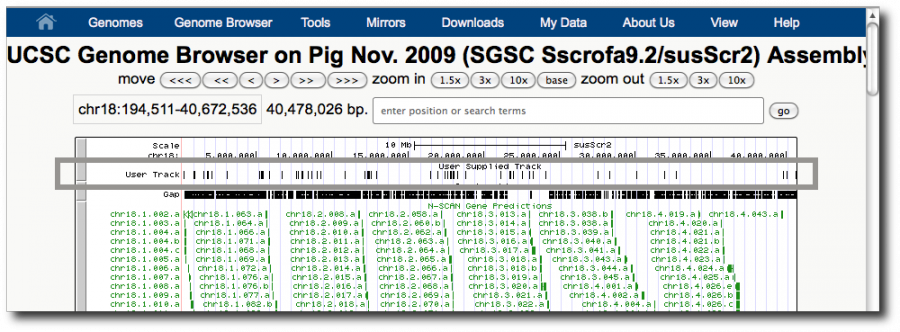
We now have our dataset in a form that can be visualized. Click on the dataset's display at UCSC main link. This launches the UCSC genome browser with this dataset shown as User Track at the top of the browser.
This highlights one of the strengths of genome browsers: showing information in context. Correlations can be obvious in a genome browser and show relationships that you would never even think to ask about.
However, this display does not tell us a lot about our exons with repeats. In GBrowse, we could write a Perl snippet that highlights each exon's repeat scores using colors or height. In UCSC we can specify we only want to see scores above n, but it requires a sometimes slow round trip to the server.
It turns out that we can also visualize this information in Galaxy.
Visualization in Galaxy
Edit universe_wsgi.ini and uncomment:
<python>enable_tracks = True</python>
Restart Galaxy. We have now enabled Trackster, Galaxy's integrated visualization framework.
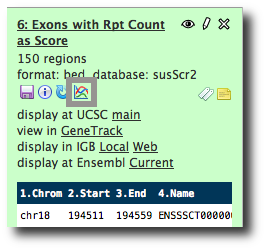
Now, refresh your browser by clicking on the Analyze Data tab, and then click on the exon-repeat dataset. Note that the Trackster icon now appears in the dataset's details.
And we would click on that and show you something really spiffy, but, um, there's ...
A bug!
There's a bug in Trackster where it does not support dynamic filtering of 6 column BED tracks. (This was identified while preparing this tutorial and a fix is in progress.)
So, let's find a workaround. Fortunately, there is no such bug with GFF, so let's convert the datasets we want to visualize to GFF before visualizing them.
Select Tools → Convert Formats → BED-to-GFF converter. Select the exon dataset that was downloaded from UCSC (probably dataset 1) and click execute. Rename the new dataset to something like Pig Chr18 Exons GFF.
Repeat this step for the repeats dataset from UCSC (probably dataset 2) and for the exons with overlapping repeats dataset (probably dataset 7).
Rename all 3 converted datasets.
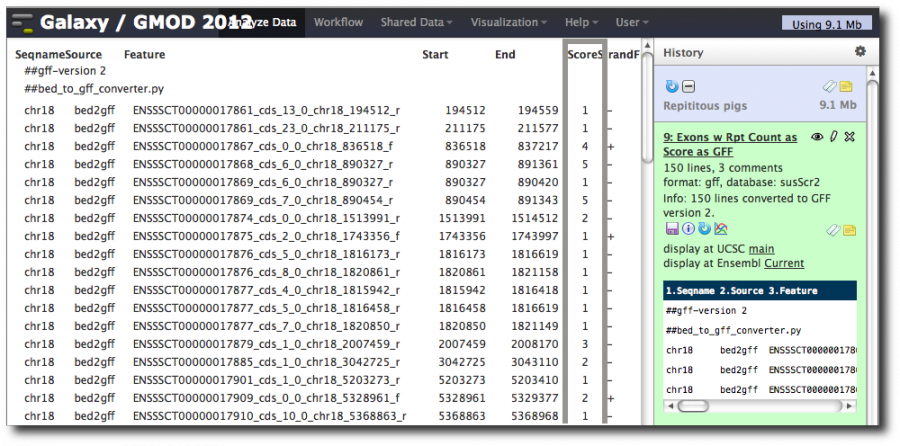
Poke the converted Exon-Repeats dataset in the eye. You should see a valid GFF file with the score column set to the repeat count.
Let's do some visual analytics, almost
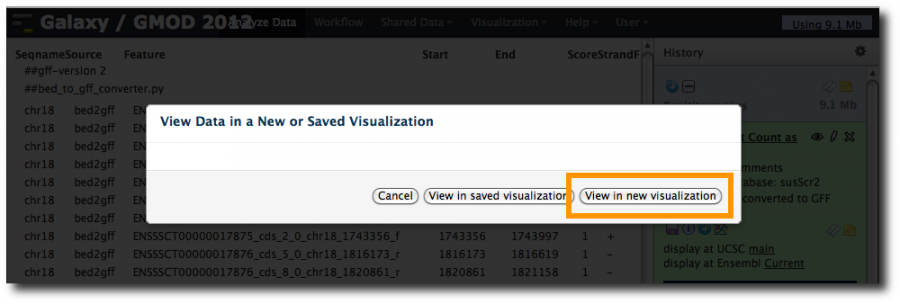
Now, click on the Trackster icon for one of the converted datasets. This will show a popup:
Select View in new visualization. This launches a new popup asking for a browser name and shows an empty Reference genome build pull-down menu. As Galaxy admins, we haven't yet told Trackster about reference genomes (see below for how to do this). Fortunately, you can visualize any genome in Galaxy if you provide a definition of the genome.
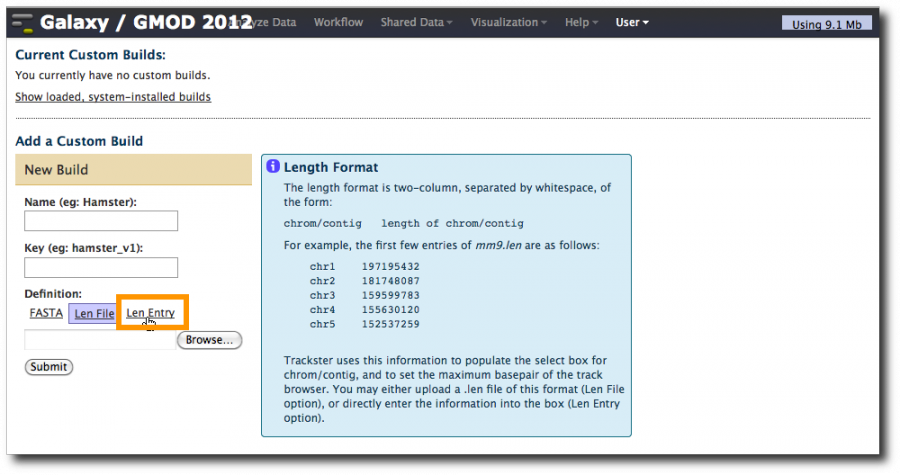
Click on Add a Custom Build
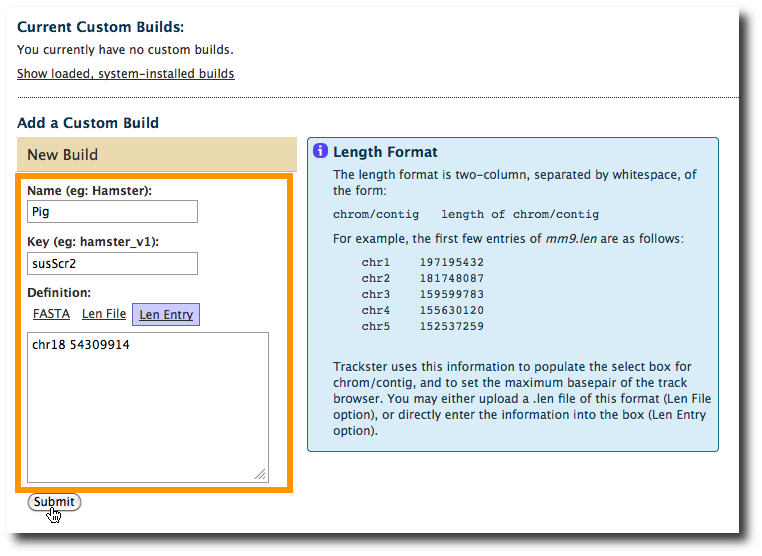
At this point we can create a custom len entry. Since our data only covers chr18, that's all we need to define. We can get the length of chromosome 18 (54309914) from the original names assigned to the downloaded UCSC datasets. Click on the Len entry tab. Set Name to Pig, Key to susScr2 and enter this in the Len Entry box.
chr18 54309914
Click Submit.
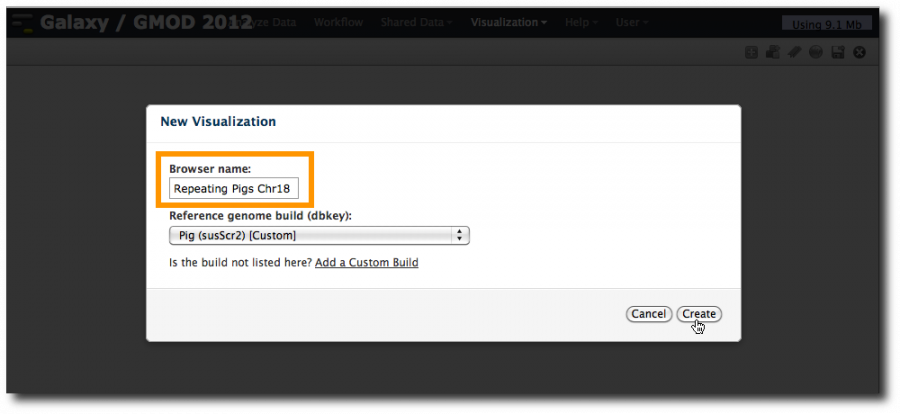
Once the custom build is created, select Visualization → New Visualization. We are now seeing Pig as an option. Enter a browser name and click Create.
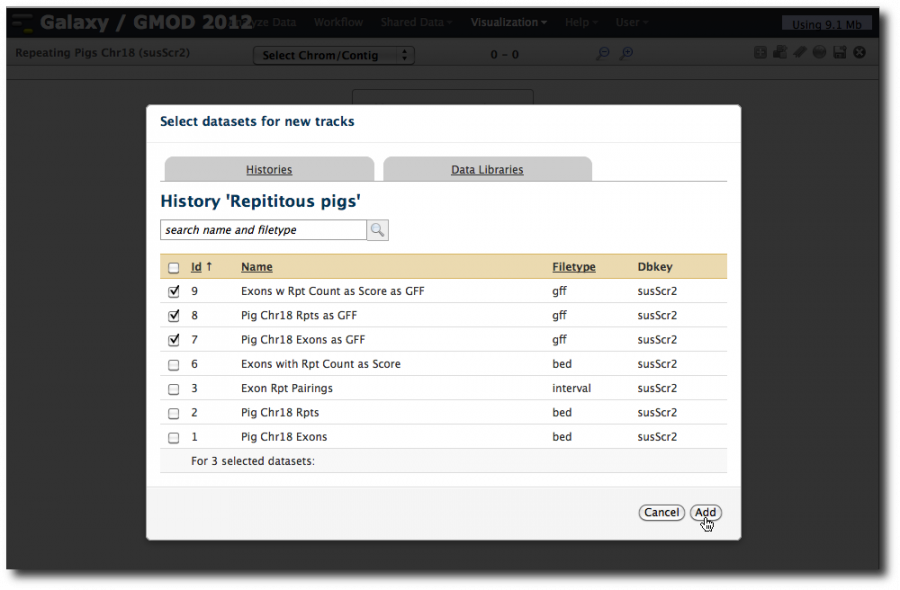
This launches a new and empty visualization. Click on Add Datasets to Visualization
Select datasets 9, 8 and 7: Exons with overlapping repeats, Repeats, and Exons, all in their GFF incarnations. Click Add.
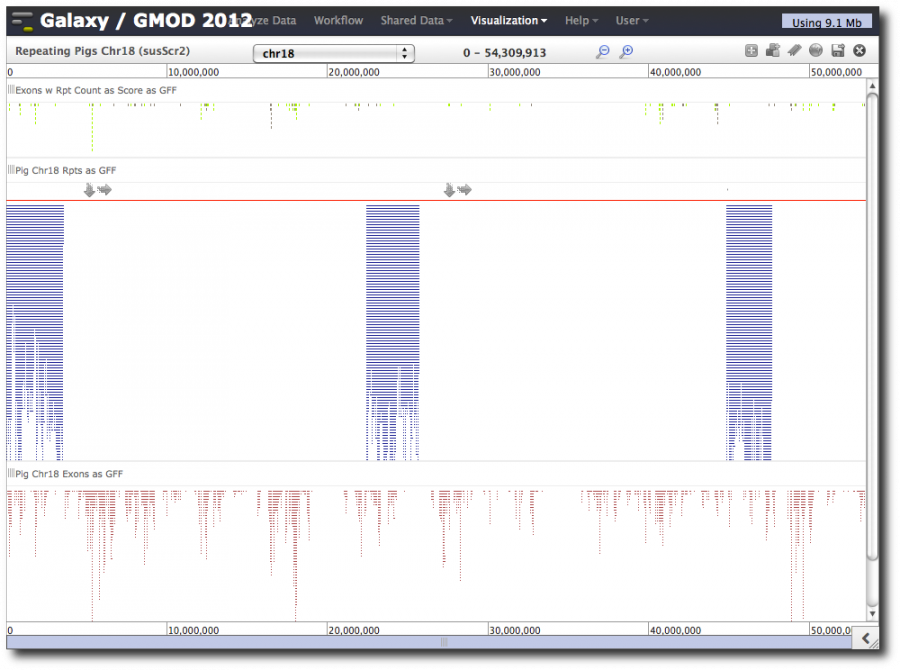
This will launch a new visualization with the three tracks/datasets we just added. It will take a few moments to load the visualization. While it is loading, select chr18 from the pull-down.
When loading is finished, the whole chromosome is shown, and not all the repeats are shown. We can now zoom, pan, and do the usual browser operations.
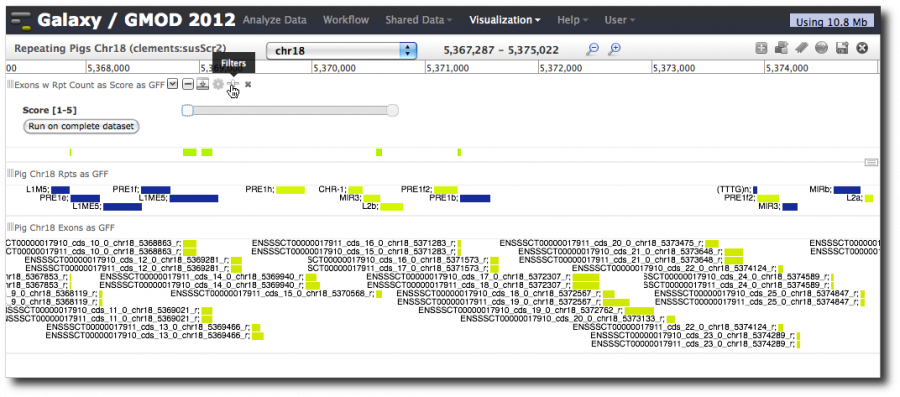
As we zoom in, the display changes (semantic zooming). Now, let's use Trackster's dynamic filtering capability. Hover over the exon-repeats track or the repeats track and click on the slider icon. This displays sliders for the score columns and can be used to display only a subset of the data in the track. Slide it.
Also, note the Run on complete dataset link. This is a first step towards visual analytics, using visualization to guide analysis in a tight analyze-visualize-repeat loop. Clicking that link will cause the step that produced the dataset to be run again.
Um, so what? Here that step is to convert from BED to GFF. We can run that as many times as we want and it will always produce the same result (we hope!). However, if this step were, for example, a Cufflinks run, then this would give us much more power.
Please don't all do this along with me. If we all do this, it may swamp the server.
There is a saved dynamic filtering visualization on http://usegalaxy.org that demonstrates this well.
Defining Genomes to Trackster
In the visualization example we added a custom genome as a user. See the Galaxy Extras page for how to add a genome to the server so that everyone can see it. We won't be covering this during the workshop.
Second Peek at the Plumbing
Now that we've run some analyses, let's look at how Galaxy is organized and how it handles our data. Bring up another terminal window and enter
$ cd Galaxy/galaxy-dist
Data and metadata
Datasets are stored in the file system, by default in the database/files/ directory hierarchy.
$ find database/files/
database/files/000
database/files/000/dataset_10.dat
database/files/000/dataset_6.dat
database/files/000/dataset_15.dat
database/files/000/dataset_8.dat
database/files/000/dataset_7.dat
database/files/000/dataset_16.dat
...
All of the datasets corresponding to our history items are stored in this directory. Datasets are broken up into a hierarchy based on ID to avoid problems with particular file systems. If we look at a single file:
$ head database/files/000/dataset_1.dat
chr18	91258	91403	ENSSSCT00000017860_cds_0_0_chr18_91259_f	0	+
chr18	91641	91739	ENSSSCT00000017860_cds_1_0_chr18_91642_f	0	+
chr18	115932	116030	ENSSSCT00000017860_cds_2_0_chr18_115933_f	0	+
chr18	119260	119402	ENSSSCT00000017860_cds_3_0_chr18_119261_f	0	+
chr18	123937	124088	ENSSSCT00000017860_cds_4_0_chr18_123938_f	0	+
chr18	124729	124790	ENSSSCT00000017860_cds_5_0_chr18_124730_f	0	+
chr18	126339	126409	ENSSSCT00000017860_cds_6_0_chr18_126340_f	0	+
chr18	126927	127019	ENSSSCT00000017860_cds_7_0_chr18_126928_f	0	+
chr18	131229	131359	ENSSSCT00000017860_cds_8_0_chr18_131230_f	0	+
chr18	131428	131470	ENSSSCT00000017860_cds_9_0_chr18_131429_f	0	+
we see that Galaxy just stores the raw data exactly as we uploaded it.
Other information is stored in the database galaxydb as we specified earlier. Let's take a look at that
$ psql galaxydb
psql (8.4.12)
Type "help" for help.
galaxydb=#
For example, let's look at the first dataset we created:
galaxy_test=# select * from history_dataset_association where id = 1;
 id | history_id | dataset_id |        create_time        |        update_time         | copied_from_history_dataset_association_id | hid |      name       |                     info                     |     blurb     |                                       peek                                        | extension |                                                                                                                        metadata                                                                                                                        | parent_id | designation | deleted | visible | copied_from_library_dataset_dataset_association_id | state | purged | tool_version
----+------------+------------+---------------------------+----------------------------+--------------------------------------------+-----+-----------------+----------------------------------------------+---------------+-----------------------------------------------------------------------------------+-----------+--------------------------------------------------------------------------------------------------------------------------------------------------------------------------------------------------------------------------------------------------------+-----------+-------------+---------+---------+----------------------------------------------------+-------+--------+--------------
  1 |          2 |          1 | 2012-08-20 23:35:51.91577 | 2012-08-20 23:41:12.074085 |                                            |   1 | Pig Chr18 Exons | UCSC Main on Pig: ensGene (chr18:1-54309914) | 3,399 regions | chr18   91258   91403   ENSSSCT00000017860_cds_0_0_chr18_91259_f        0       + | bed       | {"chromCol": [1], "column_types": ["str", "int", "int", "str", "int", "str"], "columns": 6, "comment_lines": null, "data_lines": 3399, "dbkey": ["susScr2"], "endCol": [3], "nameCol": [4], "startCol": [2], "strandCol": [6], "viz_filter_cols": [5]} |           | output      | f       | t       |                                                    |       | f      |
                                                                                                                                                                                                                           :
                                                                                                                                                                                                                           : chr18   91641   91739   ENSSSCT00000017860_cds_1_0_chr18_91642_f        0       +
                                                                                                                                                                                                                           :
                                                                                                                                                                                                                           : chr18   115932  116030  ENSSSCT00000017860_cds_2_0_chr18_115933_f       0       +
                                                                                                                                                                                                                           :
                                                                                                                                                                                                                           : chr18   119260  119402  ENSSSCT00000017860_cds_3_0_chr18_119261_f       0       +
                                                                                                                                                                                                                           :
                                                                                                                                                                                                                           : chr18   123937  124088  ENSSSCT00000017860_cds_4_0_chr18_123938_f       0       +
                                                                                                                                                                                                                           :
                                                                                                                                                                                                                           : chr18   124729  124790  ENSSSCT00000017860_cds_5_0_chr18_124730_f       0       +
                                                                                                                                                                                                                           :
(1 row)
We see that this table tracks information the Galaxy interface needs to work with this dataset, including user defined fields such as name and info, as well as the first few lines of the dataset ("peek"), and the type specific metadata.
Exit the PostgreSQL results page by pressing q. Exit psql by typing \q.
Tools
Galaxy reads all of its tool configuration from a series of XML files. The file tool_conf.xml defines which tools are loaded by a given instance:
$ head tool_conf.xml
<xml><?xml version="1.0"?> <toolbox>
 <section name="Get Data" id="getext">
   <tool file="data_source/upload.xml"/>
   <tool file="data_source/ucsc_tablebrowser.xml" />
   <tool file="data_source/ucsc_tablebrowser_test.xml" />
   <tool file="data_source/ucsc_tablebrowser_archaea.xml" />
   <tool file="data_source/bx_browser.xml" />
   <tool file="data_source/ebi_sra.xml"/>
   <tool file="data_source/microbial_import.xml" /></xml>
This file defines the menu hierarchy that appears in the Tools panel on the left. Each referenced file contains the description of a particular tool.
Let's take a look at one of the tools we used during the exercise, the join on genomic intervals operation we did after downloading the exons and repeats.
<xml> <section name="Operate on Genomic Intervals" id="bxops">
   <tool file="new_operations/intersect.xml" />
   <tool file="new_operations/subtract.xml" />
   <tool file="new_operations/merge.xml" />
   <tool file="new_operations/concat.xml" />
   <tool file="new_operations/basecoverage.xml" />
   <tool file="new_operations/coverage.xml" />
   <tool file="new_operations/complement.xml" />
   <tool file="new_operations/cluster.xml" id="cluster" />
   <tool file="new_operations/join.xml" />
   <tool file="new_operations/get_flanks.xml" />
   <tool file="new_operations/flanking_features.xml" />
   <tool file="annotation_profiler/annotation_profiler.xml" />
 </section></xml>
The XML file is in several sections. The syntax is defined at Tool Config Syntax on the Galaxy wiki.
% less tools/new_operations/join.xml
Specify what appears in the Tools panel for this tool.
<xml><tool id="gops_join_1" name="Join">
<description>the intervals of two datasets side-by-side</description></xml>
Specify the command line command to run for this tool.
<xml> <command interpreter="python">gops_join.py $input1 $input2 $output -1 ${input1.metadata.chromCol},${input1.metadata.startCol},${input1.metadata.endCol},${input1.metadata.strandCol} -2 ${input2.metadata.chromCol},${input2.metadata.startCol},${input2.metadata.endCol},${input2.metadata.strandCol} -m $min -f $fill</command></xml>
Define the parameters to this tool. In this case there are 4:
<xml> <inputs>
   <param format="interval" name="input1" type="data" help="First dataset">
     <label>Join</label>
   </param>
   <param format="interval" name="input2" type="data" help="Second dataset">
     <label>with</label>
   </param>
   <param name="min" size="4" type="integer" value="1" help="(bp)">
     <label>with min overlap</label>
   </param>
 <param name="fill" type="select" label="Return">
   <option value="none">Only records that are joined (INNER JOIN)</option>
   <option value="right">All records of first dataset (fill null with ".")</option>
   <option value="left">All records of second dataset (fill null with ".")</option>
   <option value="both">All records of both datasets (fill nulls with ".")</option>
 </param>
  </inputs></xml>
What are the ouptuts for this tool? In this case, a single interval file.
<xml> <outputs>
   <data format="interval" name="output" metadata_source="input1" />
 </outputs></xml>
According to Tool Config Syntax wiki page, the Code tag is
<code file="operation_filter.py"/>
Define unit tests for this tool:
<xml> <tests>
   <test>
     <param name="input1" value="1.bed" />      <param name="input2" value="2.bed" />
     <param name="min" value="1" />      <param name="fill" value="none" />
     <output name="output" file="gops-join-none.dat" />
   </test>
   ...
 </tests></xml>
Finally, define the help text to display for this tool.
<xml> <help>
.. class:: infomark
- TIP:** If your dataset does not appear in the pulldown menu, it means that it is not in interval format. Use "edit attributes" to set chromosome, start, end, and strand columns.
- Screencasts!**
See Galaxy Interval Operation Screencasts_ (right click to open this link in another window).
.. _Screencasts: http://wiki.g2.bx.psu.edu/Learn/Interval%20Operations
- Syntax**
- **Where overlap** specifies the minimum overlap between intervals that allows them to be joined. - **Return only records that are joined** returns only the records of the first dataset that join to a record in the second dataset. This is analogous to an INNER JOIN. - **Return all records of first dataset (fill null with ".")** returns all intervals of the first dataset, and any intervals that do not join an interval from the second dataset are filled in with a period(.). This is analogous to a LEFT JOIN.
...
</help> </tool></xml>
Test and help details have been removed from the listing here. The <help> section describes the tool. This text is displayed on the tool page. The markup used is reStructured Text (RST), a popular markup language in the Python community.
This file contains everything necessary to define the user interface of the tool. It also describes how to take a set of user input values from the generated user interface, and construct a command line to actually run the tool. Nearly all tools in Galaxy are constructed in this way -- any analysis that can be run from the command line can be integrated into a Galaxy instance.
Galaxy Tool Shed
In previous years, we created a tool at this point in the workshop. This year we are sacrificing that section in order to cover other things like visualization, sharing, Galaxy CloudMan, and the Galaxy Tool Shed.
Prior to the advent of the Galaxy Tool Shed in late 2010, if you wanted to integrate a tool into your Galaxy instance you would need to write the wrapper for it. There was no easy way to share tool definitions across the community. The Galaxy Tool Shed has changed all that, and there are now over 2000 tool definitions in the tool shed. Anyone can download and install these wrappers in local Galaxies. Let's give it a whirl.
I went looking for a tool that I could use to tell me something about repeats and exons datasets that we started with. I found bed_size_stat.
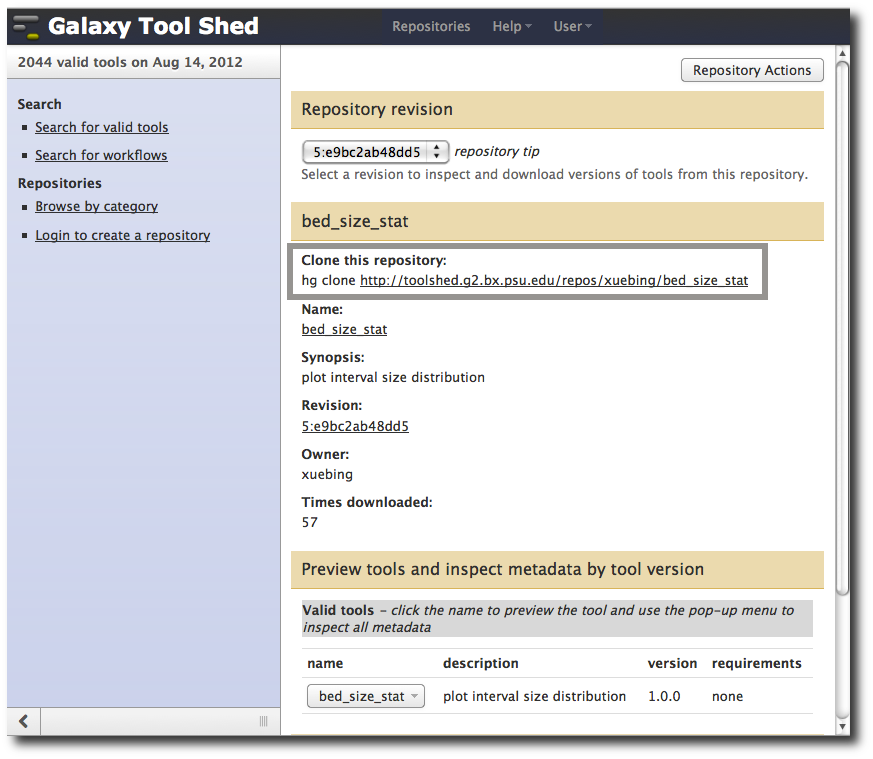
- Go to http://toolshed.g2.bx.psu.edu/.
- Search for bed_size_stat.
- Click on the bed_size_stat button
This tool plots "interval size distribution." Click on the bed_size_stat button for a preview of what the tool looks like when run in Galaxy.
OK, looks good. Let's try it.
Installing a tool
To copy a tool from the Tool Shed into your local Galaxy go to your tools directory and Mercurial clone it. The specific url to clone tools in the tool shed are shown on the tool's page.
$ cd tools
$ hg clone http://toolshed.g2.bx.psu.edu/repos/xuebing/bed_size_stat
destination directory: bed_size_stat
requesting all changes
adding changesets
adding manifests
adding file changes
added 6 changesets with 6 changes to 2 files
updating to branch default
2 files updated, 0 files merged, 0 files removed, 0 files unresolved
$ <span="enter">ls bed_size_stat</span>
bed_size_stat.py  bed_size_stat.xml
Let's look at the XML
$ cat bed_size_stat/bed_size_stat.xml
<xml><tool id="bed_size_stat" name="bed_size_stat">
 <description>plot interval size distribution</description>
 <command interpreter="python">bed_size_stat.py $input $output $log </command>
 <inputs>
   <param name="input" format="txt" type="data" label="Plot the size distribution of the following file"/>
   <param name="log" label="log plot" type="boolean" truevalue="log" falsevalue="none" checked="true"/>
 </inputs>
 <outputs>
   <data format="pdf" name="output" />
 </outputs>
 <help>
- What it does**
This tool generates a histogram of the interval size.
</help>
</tool></xml>
It runs the .py file. Let's look at that:
$ cat bed_size_stat/bed_size_stat.py
<python> plot histogram of interval size
import os,sys
inputfile = sys.argv[1] outputfile = sys.argv[2] log = sys.argv[3]
rf = open('tmp.r','w') rf.write("x <- read.table('"+inputfile+"')\n") rf.write("len <- x[,3]-x[,2]\n") rf.write("pdf('"+outputfile+"')\n") if log == 'log':
   rf.write("len <- log10(len+1)\n")
   rf.write("hist(len,breaks=100,xlab='interval size (log10)',main=paste('mean=',mean(len),sep=))\n")
else:
rf.write("hist(len,breaks=100,xlab='interval size',main=paste('mean=',mean(len),sep=))\n")
rf.write("dev.off()") rf.close() os.system("R --vanilla < tmp.r") os.system('rm tmp.r')</python>
This uses the os and sys Python Modules, both of which are part of Python's standard library, and are therefore already installed. It also appears to call R which may or may not be installed. Find out:
$ <span="enter">which R</span>
$
Nope. Let's install it.
$ sudo apt-get install r-recommended
Reading package lists... Done
Building dependency tree
0 upgraded, 58 newly installed, 0 to remove and 26 not upgraded.
Need to get 52.8MB of archives.
After this operation, 160MB of additional disk space will be used.
Do you want to continue [Y/n]? <span="enter">Y</span>
...
Setting up build-essential (11.4build1) ...
Setting up r-base-dev (2.10.1-2) ...
Processing triggers for libc-bin ...
ldconfig deferred processing now taking place
$ which R
/usr/bin/R
$
The prerequisites for this tool are now installed. Expose the tool in Galaxy.
Edit tool_conf.xml and add this section:
<?xml version="1.0"?>
<toolbox>
  <section name="GMOD 2012" id="gmod2012">
    <tool file="bed_size_stat/bed_size_stat.xml"/>
  </section>
  <section name="Get Data" id="getext">
    <tool file="data_source/upload.xml"/>
    <tool file="data_source/ucsc_tablebrowser.xml" />
    <tool file="data_source/ucsc_tablebrowser_test.xml" />
    <tool file="data_source/ucsc_tablebrowser_archaea.xml" />
    <tool file="data_source/bx_browser.xml" />
    <tool file="data_source/ebi_sra.xml"/>
    <tool file="data_source/microbial_import.xml" />
Restart Galaxy:
<control-c>
$ sh run.sh --reload
We now have a GMOD 2012 item in the Tools panel. Click on it and then bed_size_stat as well. Select the dataset containing just the exons that overlap repeats, uncheck log plot and click Execute.
Once this task is done, poke the eye icon to see the generated graph.
Now repeat the job, this time on all exons.
Not surprisingly, longer exons are more likely to have repeats in them.
Sharing, Publishing, and Reusing
In Galaxy users can share or publish any Galaxy object. Let's first define some terms in Galaxy:
- In Galaxy, sharing means making it accessible to specific people, either other Galaxy accounts, or people that you send a link to.
- Publishing an object adds it to that Galaxy's Shared tab, making it easy for anyone to find it.
- A Galaxy history is a series of analysis steps, plus the input datasets, intermediate results and output results. A history describes a particular execution of steps on specific data.
- A Galaxy workflow is a series of analysis steps. Workflows do not include any data - only the series of steps. A workflow describes the process.
- A Galaxy page explains the reasons behind the steps and choices made in a history or workflow.
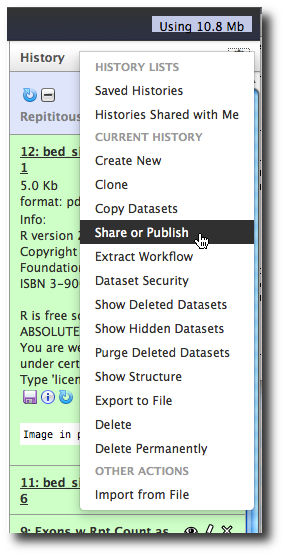
To share the history we just created, in the top bar of the History panel, click Cog → Share or Publish.
There are three (rather self-explanatory) options:
- Make History Accessible via Link
- Make History Accessible and Publish
- Share with a User
Click Make History Accessible and Publish. This shows you a URL that others can use to see your history. It also adds this history to the list of shared histories on your server.
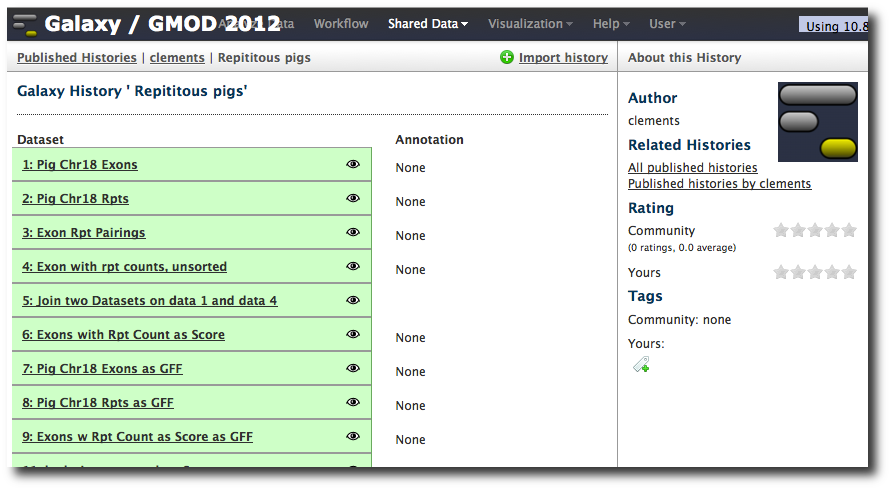
Select Shared Data → Published Histories. Anyone on your Galaxy instance can now see this history, and make their own copy of it. Click on the shared history.
Note that, on this copy at least, that while the datasets have good names, the steps are a little sparse on annotation. Before publishing a history you may want to add some annotation to help people understand it. Let's do that now.
Click Analyze Data to show the current history. Click on the name of one of the datasets. For example, the join results:
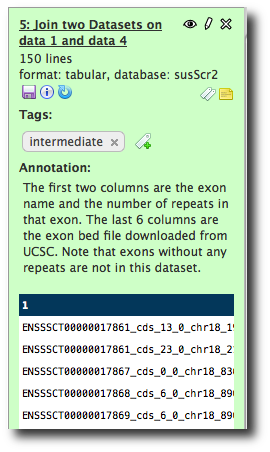
Now, note the tags and sticky note icons. You can add annotation in the form of tags or free form text by clicking on these icons. Click on the sticky note and then in the Annotation text box. Enter some text describing this dataset, and then hit return. Now, click on the tags icon and enter a text tag. Hit return.
If we go to the shared histories list and bring up the history, the annotation is now shown. Note that you can also assign annotation and tags to the history as a whole by clicking on the icons at the top of the history panel.
Galaxy Workflows
The Galaxy workflow system allows analysis containing multiple tools to be built, run, extracted from histories, and rerun. Let's extract a workflow for the analysis we just performed.
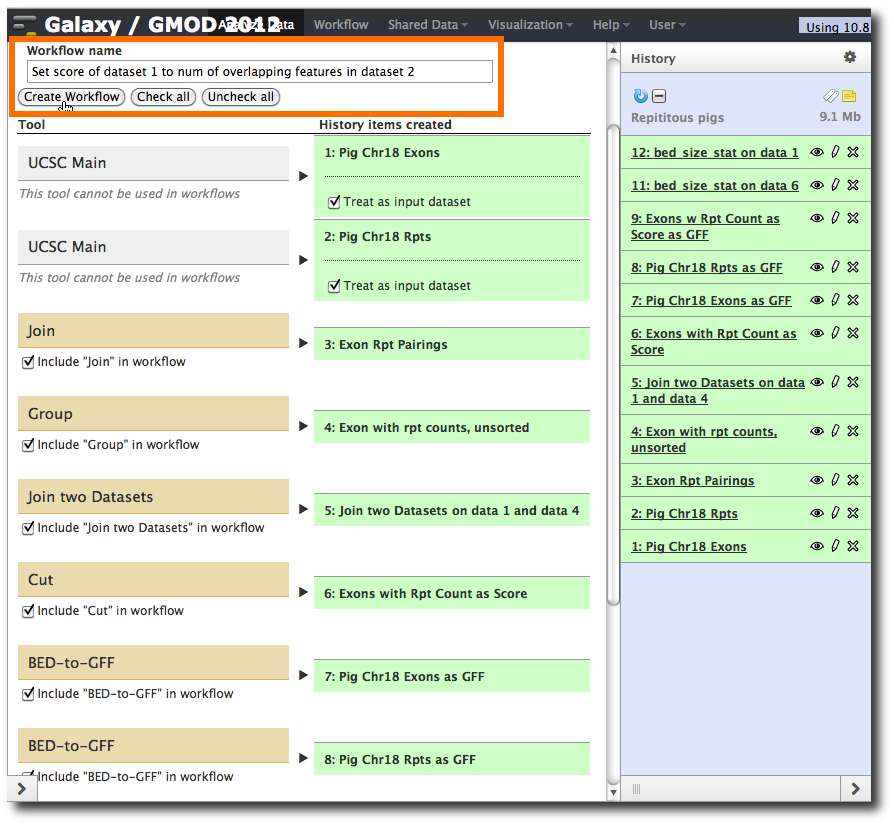
In the top bar of the History panel, select Cog → Extract Workflow.
Set the Workflow name to something more meaningful. This could be something like Count repeats in exons in pig. However that is unnecessarily restrictive. This workflow can be used with any species, not just pigs. Also, it doesn't have to count repeats per se. It could count SNPs or any other type of genomic feature. It doesn't even have to count overlaps against exons.
In fact this workflow can be used to check any two sets of features for overlaps, and set the score of the first feature set to the number of features in the second dataset that overlap with it. Name it something like
- Set score of dataset 1 to num of overlapping features in dataset 2
That is a much better (well, more descriptive) name, but even that still doesn't capture everything.
At this point, you have the option to select a subset of steps from your history to include in the workflow. Some tools cannot be used as workflow steps (e.g. uploads) so they will instead be treated as inputs to the workflow.
There are a number of steps you might want to drop. If you don't want to run bed_size_stat in the workflow, then drop those steps. If you don't want to convert to GFF, you can drop those steps. I chose to drop the bed_size_stat steps, but not the GFF conversions.
Once you have decided what, if anything, to drop, click Create Workflow.
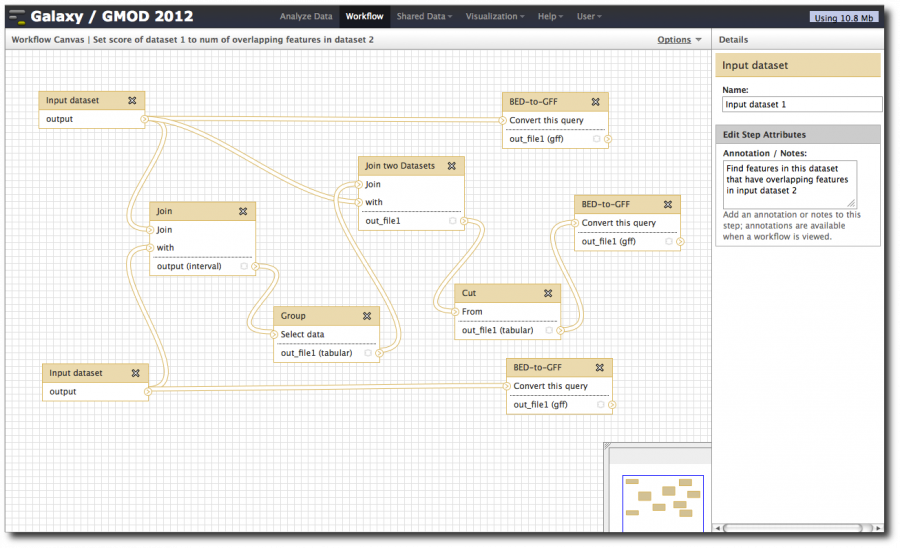
Now, from the top bar click Workflow to see a list of your workflows. You should see one workflow. Click on its name to bring up a popup menu, then click Edit to open the workflow editor. In the workflow editor, we can move steps around, label them, modify parameters or add and remove steps.
Move the steps around so you can see them all at once; add some annotation.
Once you're done, select Options → Save. Now let's rerun our analysis, this time counting the number of exons that overlap with each repeat.
Click on Workflow in the top bar, click on the workflow itself, and select Run
Whoa! This is not what we want. This will run the workflow in the current history. Start a new history. In the History panel select cog → Create New. Now select Workflow → workflow name → Run.
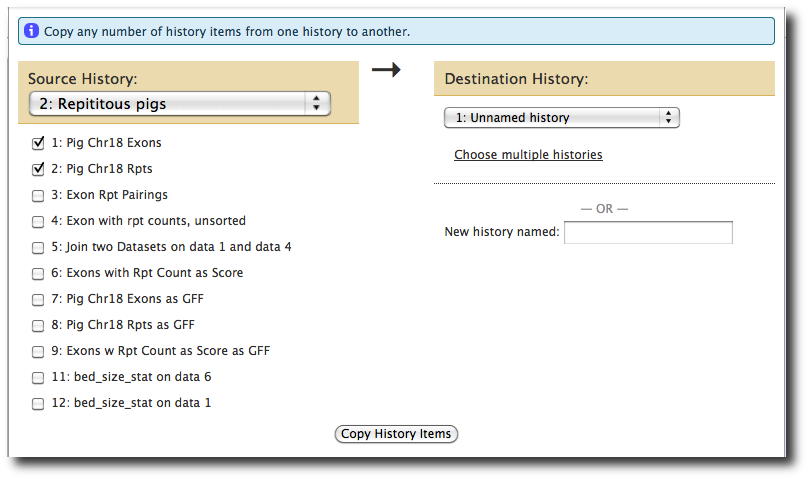
That's not quite what we want either. Now we don't have any data to operate on. Bring the repeats and exons into the current history.
In the History panel, select cog → Copy Datasets. Under Source History select the previous history, and then check the first two datasets, exons and repeats. Under Destination History select Unnamed history. Finally, click Copy History Items
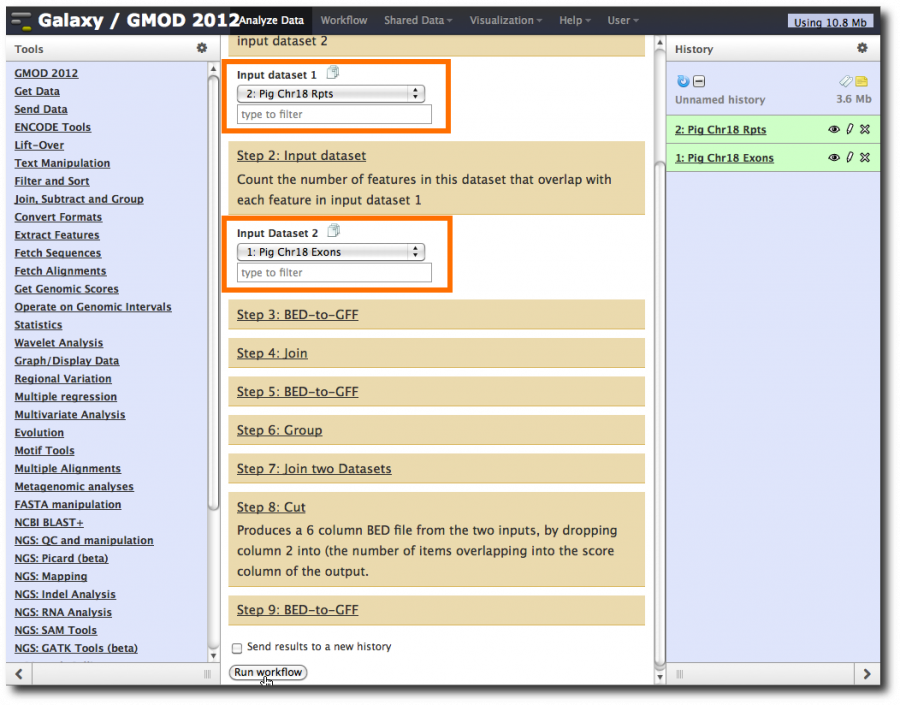
Refresh the screen by clicking Analyze Data. Now, lets run the workflow: select Workflow → workflow name → Run. Set Input Dataset 1 to the repeats dataset. Set Input Dataset 2 to the exons dataset, and click Run workflow.
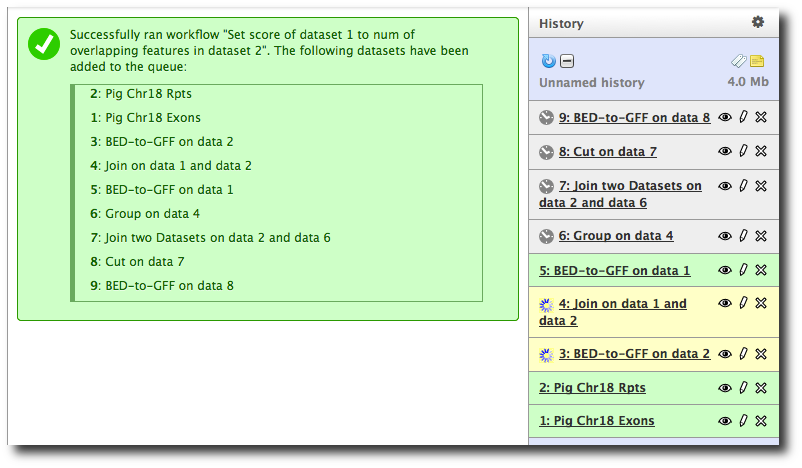
This launches the workflow. Note that steps are run in step dependency order, which may be different from the order they were originally run in, but will still produce correct results.
Also, once the workflow is created, it can also be shared and published in the same way as histories.
But ...
Note that Repeats-Exons results are incorrect!
How can we tell? What went wrong?
What are the assumptions required for this workflow to work as expected?
Galaxy Pages
Edit universe_wsgi.ini and uncomment:
<python>enable_pages = True</python>
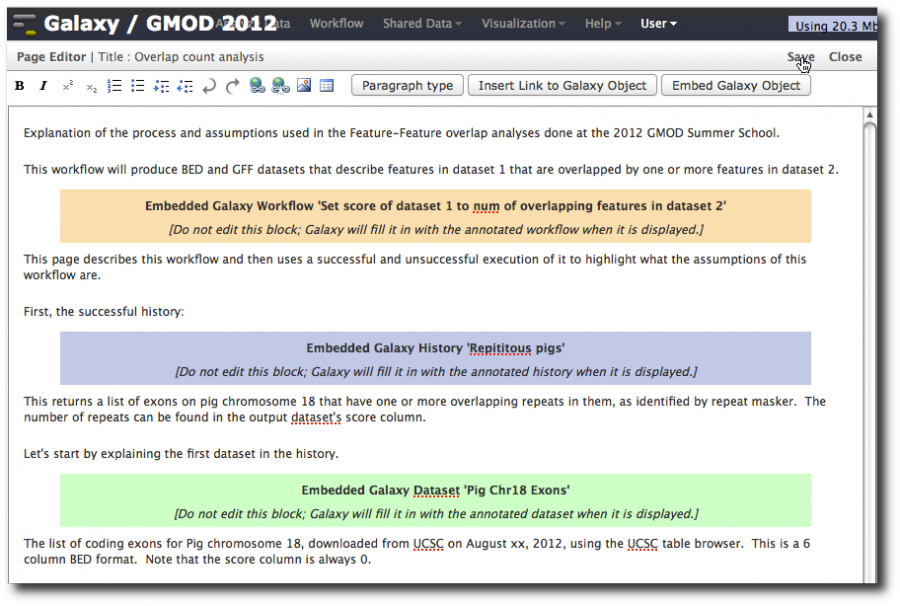
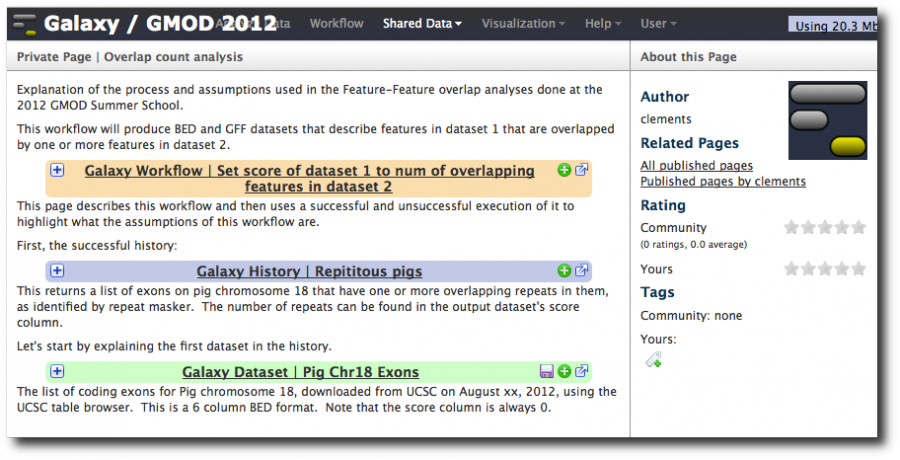
Restart Galaxy. We have now enabled Galaxy Pages, Galaxy's integrated analysis documentation framework. The Galaxy pages feature allows the creation of documents that integrate datasets, histories, and workflows. You can view workflows and histories as defining the syntax of the analysis. Pages are useful for explaining the semantics of the analysis.
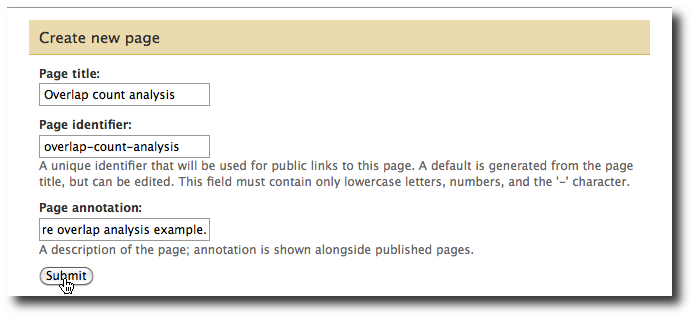
From the User menu at the top, select Saved Pages and then click Add new page. Enter a Page title and Page annotation. A URL-compatible identifier will be generated automatically. Click submit, and you will return to the list of pages.
Click the new page's name, and from the popup menu click Edit content.
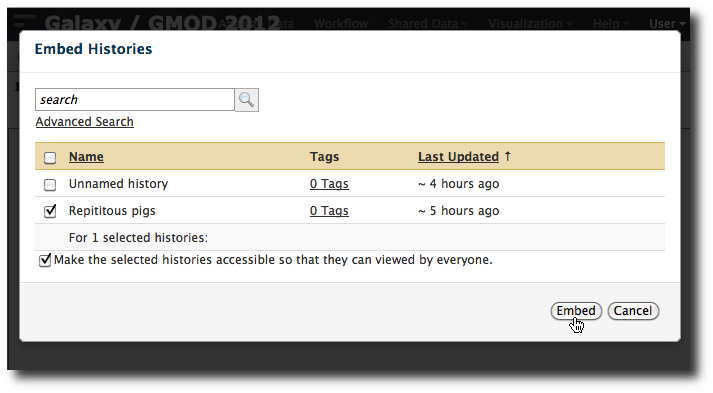
You are now in a WYSIWYG editor where you can write up your analysis for sharing. As a simple example, enter some text and then click Embed Galaxy Object → Embed History, and then select the Exon-Repeat history that worked correctly. Click Embed.
Click Save and Close to return to the page list, and click on the page's title → View to view it. You will now see your page, with your analysis history embedded. Now edit the page again. Select User → Saved pages and then click the page's name, and from the popup menu click Edit content.
Now, try to add text after the embedded history. You probably can't. Why? There is a bug in the editor. To avoid this trap, always make sure there is text before and after any inserted object. To get around this for this page, first delete the embedded history, enter a few blank lines, and then reinsert the history with blank lines after it.
Type in some more text and now insert a dataset. Also go back towards the top and insert the workflow we created. Type explanatory text everywhere. Click Save then Close. Then click on the page's name and select View.
Visualizations can be shared as well. Select Visualization → Saved Visualizations → Pig exercise visualization → Share or Publish. The resulting screen should look familiar by now.
Galaxy CloudMan
So far we have talked about two installing Galaxy on your own server. However, you can also run Galaxy on the cloud. It's easy.
Please login to your AWS account and then go to:
